About
Randy Krum
President of InfoNewt.
Data Visualization and Infographic Design

Infographic Design

Infographics Design | Presentations
Consulting | Data Visualizations

DFW DataViz Meetup

Join the DFW Data Visualization and Infographics Meetup Group if you're in the Dallas/Fort Worth area!

Search the Cool Infographics site

Custom Search

Subscriptions:


Feedburner

The Cool Infographics® Gallery:

How to add the
Cool Infographics button to your:

Cool Infographics iOS icon

- iPhone
- iPad
- iPod Touch


Read on Flipboard for iPad and iPhone

Featured in the Tech & Science category

Flipboard icon

Twitter Feed
From the Bookstore

Caffeine Poster

The Caffeine Poster infographic

Entries in environment (49)

Tuesday
Oct072008

Vampire Energy infographic video & chart

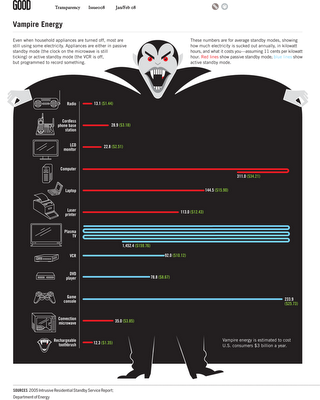
From GOOD magazine, they created an infographic video about Vampire Energy, all of the energy used by electronics in your house while you are not actively using them.  The chart itself from the magazine is fairly simple chart, but I really like it.  It's effective getting the message across with simple graphics.

Friday
Sep262008

The Rush to Wind Farms!


The rush to wind farming is an interesting article in The Atlantic.  With Federal subsidies, its almost like a land rush.  The planned expansion of wind farm sites is impressive.

Thanks for sending in the link Garrett (also posted on Capturing Ephemera)!

Friday
Aug222008

Beijing Air Quality Index


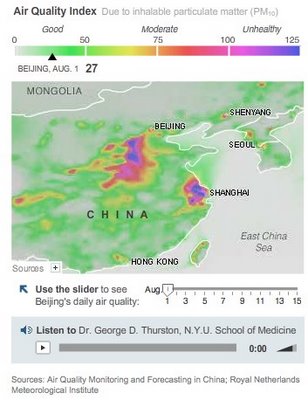
NYTimes.com is also tracking the Air Quality Index by day during the Olympics using a heatmap style graphic.  There's definitely more pollution and particles in the air than most of the participants are used to.  So far, there have been a couple of days in the 90's, but didn't cross over 100 into the "unhealthy" range.

Wednesday
Jul302008

Bio-Suit EVA Infographic Poster

From the Man Vehicle Lab at MIT, an infographic poster from professor Dava Newman and illustrator Cam Brensinger.  The poster shows the technology development in spacesuits and some future design concepts.

Friday
Jun272008

Big Blue Marble: Water and Air

Found on infosthetics.com, phiffer.com and boingboing.net

Global water and air volume. Conceptual computer artwork of the total volume of water on Earth (left) and of air in the Earth's atmosphere (right) shown as spheres (blue and pink). The spheres show how finite water and air supplies are. The water sphere measures 1390 kilometers across and has a volume of 1.4 billion cubic kilometers. This includes all the water in the oceans, seas, ice caps, lakes and rivers as well as ground water, and that in the atmosphere. The air sphere measures 1999 kilometers across and weighs 5140 trillion tonnes. As the atmosphere extends from Earth it becomes less dense. Half of the air lies within the first 5 kilometers of the atmosphere.

Credit: Adam Nieman / Photo Researchers, Inc

I'd love to see one more showing all of the oil in the world.

The original appears to be here at PhotoResearchers.com

Wednesday
Jun042008

Greenwashing


From Futerra Communications:

Our Greenwash Guide (PDF) was born out of a desire to help communications professionals get their green messaging right. The majority of Greenwash is the result of over-eager communications campaigns that lack environmental rigour rather than malicious intent.
Found on Melodies In Marketing, thanks Mario!

Tuesday
Jun032008

The Infographic that Saved a Million Lives


Great story from 37signals.com about a very simple infographic that motivated Bill and Melinda Gates to change the focus of their charity spending.

“No graphic in human history has saved so many lives in Africa and Asia,” says NY Times columnist Nicholas Kristof about an infographic in a ‘97 Times article that spurred Bill and Melinda Gates to take action on public health.

...But then bill confessed that actually it wasn’t the article itself that had grabbed him so much—it was the graphic. It was just a two column, inside graphic, very simple, listing third world health problems and how many people they kill. but he remembered it after all those years and said that it was the single thing that got him redirected toward public health.

Friday
May162008

Global Distribution of Water


From the United Nations Environment Programme website, the Global Distribution of Water specifically highlights the scarcity of freshwater.

Found on digg.com

Thursday
Apr242008

Visualizing Carbon Dioxide Emissions

This is a great way to visualize gas emissions which are normally invisible. That's why most people don't have any real sense how much is produced by the things you do in everyday life like running your washing machine or refrigerator.

The black balloons really work, with the black color implying "bad" and they're actually filled with a lighter than air gas that rises into the atmosphere. I'm assuming that the size of the balloons actually represents the 50 grams of greenhouse gas discussed in the ad.

Found on infosthetics.com and radar.oreilly.com and the original is at www.saveenergy.vic.gov.au from the Australian government.

Wednesday
Apr022008

Who Owns the Organic Food Companies?


Great chart by Phil Howard from Good Magazine showing which of the large food processing companies own some of the most popular organic food brands. Pepsi owns Naked Juice?

Found on digg.com after I heard about it on the diggnation podcast.