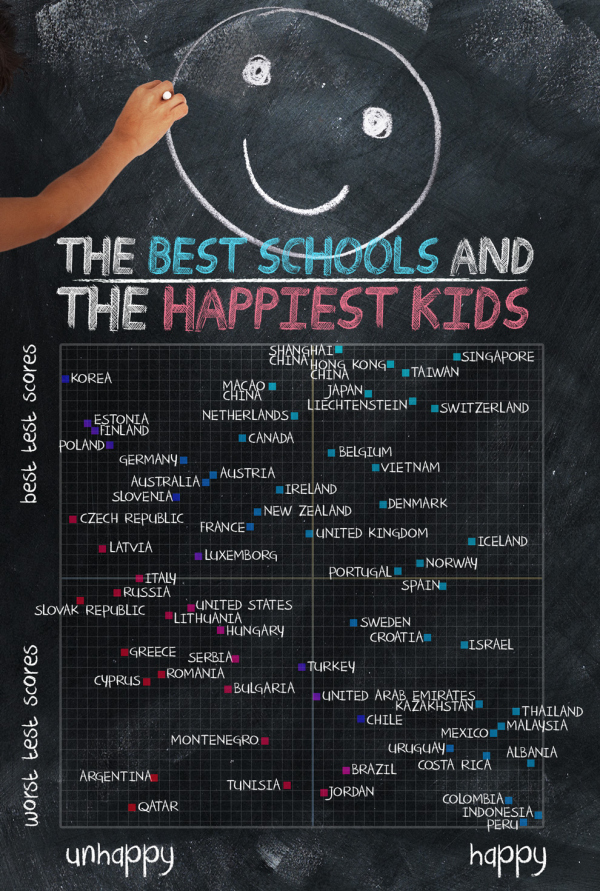
Where in the World are the Best Schools and the Happiest Kids?
The best test scores don’t always mean the happiest kids at school. The Best Schools and the Happiest Kids visualizes the results from a worldwide survey of over 500,000 15-year-olds globally.
The Organisation for Economic Co-operation and Development’s triennial international survey compared test scores from 65 countries. Happiness was ranked based on the percentage of students who agreed or disagreed with the statement “I feel happy at school.” Test scores were ranked based on the combined individual rankings of the students’ math, reading, and science scores.
I can’t tell for sure, but it appears that Jake Levy, Data Analyst at BuzzFeed created this data visualization based on the data from OECD survey results. Infographics like these often get shared without the rest of the article, so it’s important to include all of the necessary framing information in the graphics itself. Title, descriptive text, sources, URL, publishing company, copyright, etc.
Thanks to Ron Krate on Google+ for posting


 Randy
Randy
