


Entries in history (262)
 Randy
Randy

Population of the Dead - infographic
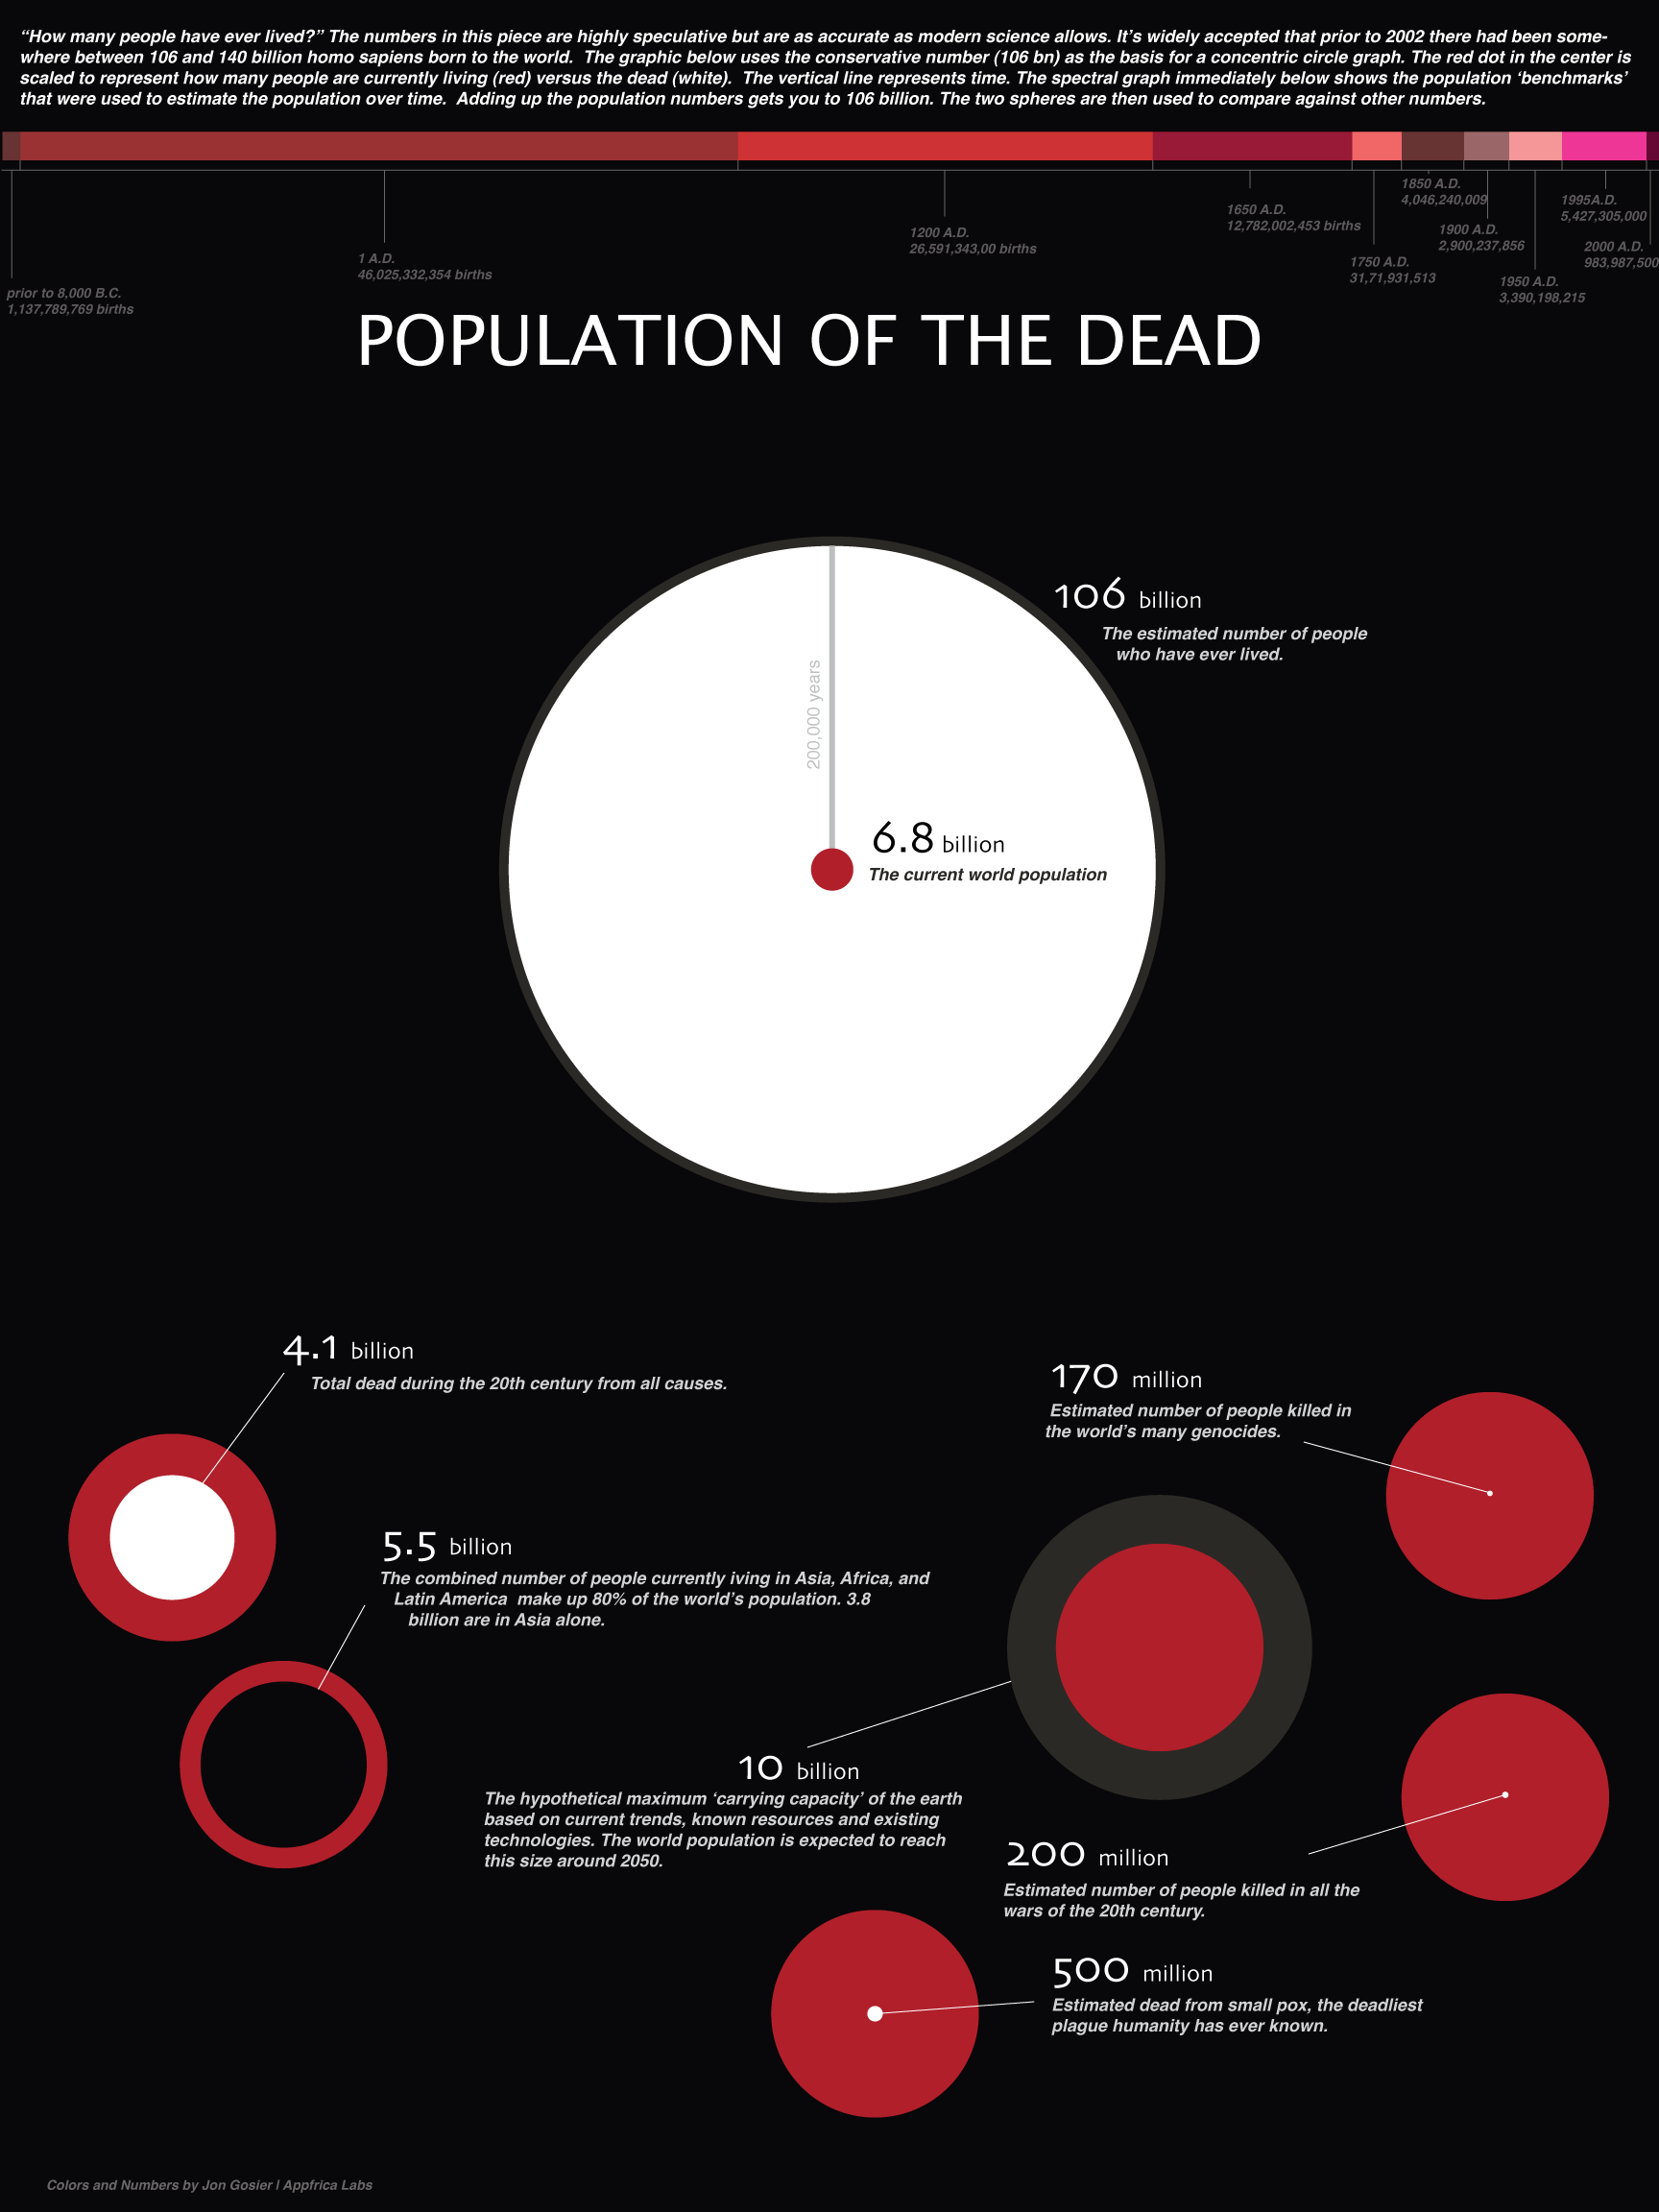
Jon Gosier, from Appfrica.com, created this infographic, Population of the Dead, to help visualize the question “How many people have ever lived?” Across the top is also a timeline of births, that helps demonstrate how quickly the population has accelerated in the last few hundred years.
![]()
Text from the image:
The numbers are highly speculative but are as accurate as modern science allows. It’s widely accepted that prior to 2002 there had been somewhere between 106 and 140 billion homo sapiens born to the world. The graphic below uses the conservative number (106 bn) as the basis for a concentric circle graph. The red dot in the center is scaled to represent how many people are currently living (red) versus the dead (white). The vertical line represents time. The spectral graph shows the population ‘benchmarks’ that were used to estimate the population over time. Adding up the population numbers gets you to 106 billion. The two spheres are then used to compare against other numbers.
The Last 10 Years...Visually

Great chart by Phillip Niemeyer over on NYTimes.com, Picturing the Past 10 Years. Using icons and unique pictures, Phillip captures the key event of each year in 12 different categories.

Found on FlowingData, WeLoveDataVis, and it was tweeted but a few people on my Twitter list, Cool Infographics People.
The Holiday Economy

Our Present Economy is a look at holiday spending from 1997-2007 with some specifics about 2007. It doesn't say explicitly, but I believe this is for the U.S. only. From GOOD Magazine, this Good Sheet was available at Starbucks during the holiday season in 2008.
I wonder how 2009 compares?
The Origins and Paths of Epidemics

This world map shows the origins and spreading paths of Malaria, Leprosy and Small Pox. No legend, but the implication is that as the main arteries diminish in width down to small capillaries represents the number of infection cases. Key dates and locations are also identified with event description.
There is no designer byline on the graphic, but map is credited to Haisam Hussein. I don't see the map in the gallery on Haisam's website, but he is given credit for the map on Lapham's Quarterly.
Found on digg.com.
A Visual History of the Supreme Court - New Infographic Poster!

Today, I want to share the launch of Timeplots.com. A new infographic site focused on designing visual timelines by Nathaniel Pearlman and Frank Hamilton. The Timeplots.com site launched today highlighting their first project; a poster called “A Visual History of the Supreme Court of the United States”.
This large-scale (48″x32″) print displays the full sweep of American federal judicial history from 1789 to 2009. It combines biographical information on every Supreme Court justice with a visualization of the influence of U.S. presidents and their political parties on the Court over time, and includes vote counts and summaries of landmark cases.
Months of work went into researching the history of the Supreme Court, and that effort really shows through in the level of detail in this poster.

It’s a good thing they offer this as a large format poster, because the detail draws you closer to discover the events and landmark decisions that are the colorful history of the SCOTUS (Supreme Court of the United States).


I love that even on their About page, they created small, infographic timelines as a visual of their individual experiences and career histories. Here’s Nathaniel’s:

Timeplots has also started a new service, Timeplots on Demand:
Timeplots’ dedicated staff is ready to work directly with you to honor your own organization—your company, school, nonprofit, team, church, or family—with a custom Timeplot of your institution’s history. Let us help you collect data, create memorable images, and visualize the developments of your institution.
Congratulations to both Nathaniel and Frank!
Florence Nightingale: Causes of Mortality infographic from 1858!

This "Diagram of the causes of mortality in the army in the East" was published in Notes on Matters Affecting the Health, Efficiency, and Hospital Administration of the British Army and sent to Queen Victoria in 1858.
This graphic indicates the number of deaths that occured from preventable diseases (in blue), those that were the results of wounds (in red), and those due to other causes (in black).
The legend reads:
The Areas of the blue, red, & black wedges are each measured from the centre as the common vertex. The blue wedges measured from the centre of the circle represent area for area the deaths from Preventable or Mitigable Zymotic diseases, the red wedges measured from the centre the deaths from wounds, & the black wedges measured from the centre the deaths from all other causes. The black line across the red triangle in Nov. 1854 marks the boundary of the deaths from all other causes during the month. In October 1854, & April 1855, the black area coincides with the red, in January & February 1855,(*) the blue coincides with the black. The entire areas may be compared by following the blue, the red, & the black lines enclosing them.Also from Wikipedia:
Florence Nightingale had exhibited a gift for mathematics from an early age and excelled in the subject under the tutorship of her father. Later, Nightingale became a pioneer in the visual presentation of information and statistical graphics. Among other things she used the pie chart, which had first been developed by William Playfair in 1801.
Florence Nightingale is credited with developing a form of the pie chart now known as the polar area diagram, or occasionally the Nightingale rose diagram, equivalent to a modern circular histogram to illustrate seasonal sources of patient mortality in the military field hospital she managed. Nightingale called a compilation of such diagrams a "coxcomb", but later that term has frequently been used for the individual diagrams. She made extensive use of coxcombs to present reports on the nature and magnitude of the conditions of medical care in the Crimean War to Members of Parliament and civil servants who would have been unlikely to read or understand traditional statistical reports.
In her later life Nightingale made a comprehensive statistical study of sanitation in Indian rural life and was the leading figure in the introduction of improved medical care and public health service in India.
In 1859 Nightingale was elected the first female member of the Royal Statistical Society and she later became an honorary member of the American Statistical Association.Found this while reading the great FlowingData post "9 Ways to Visualize Proportions – A Guide" by Nathan Yau.
KXVTA2R4XWE3
FRJK52DWMBJQ
The Timeline of Michael Jordan

Created by Khoi Nguyen as a class project, The Timeline of Michael Jordan lays out the key events of his spectacular career with iconic images representative of each time period. A little design work work makes what could be a simple timeline into a great infographic that draws the reader in.
Check out Khoi's blog/portfolio.
Great work Khoi!
A Graphic History of Newspaper Circulation

From The Awl, this certainly isn't the prettiest infographic I've ever seen (it's basically just a line chart), but it tells it's story to the viewer very well. Maybe there are times when a simple chart from Excel can do the job...NAH. From a title that proclaims "A Graphic History of Newspaper Circulation" we certainly expect much more visual information.
I'm sure many of the graphic designers reading this blog could turn this data into a significantly better infographic (hint, hint...).
Every six months, the Audit Bureau of Circulations releases data about newspapers and how many people subscribe to them. And then everyone writes a story about how some newspapers declined some amount over the year previous. Well, that's no way to look at data! It's confusing—and it obscures larger trends. So we've taken chunks of data for the major newspapers, going back to 1990, and graphed it, so you can see what's actually happened to newspaper circulation. (We excluded USA Today, because we don't care about it. If you're in a hotel? You're reading it now. That's nice.)
Some surprising trends: the New York Post has the same circulation it had two decades ago! Also, the once-captivating battle of the New York City tabloids has become completely moot.
Some unsurprising trends: the Los Angeles Times is an absolute horrorshow. Not shown: the Boston Globe disappearing off the bottom of this chart, in a two decade decline from 521,000 in 1990 to 264,105 this year.Found on Daring Fireball.
50 Years of Space Exploration - Visual Flight Map

National Geographic published this amazing flight map that shows the flight paths of all 200 space missions in the last 50 years. A zoomable map is on the NG website, and a high-res image is available from Adam Crowe on Flickr.
Art by Sean McNaughton, National Geographic Staff, Samuel Velasco, 5W Infographics.
Found on Fast Company.