About
Randy Krum
President of InfoNewt.
Data Visualization and Infographic Design

Infographic Design

Infographics Design | Presentations
Consulting | Data Visualizations

DFW DataViz Meetup

Join the DFW Data Visualization and Infographics Meetup Group if you're in the Dallas/Fort Worth area!

Search the Cool Infographics site

Custom Search

Subscriptions:


Feedburner

The Cool Infographics® Gallery:

How to add the
Cool Infographics button to your:

Cool Infographics iOS icon

- iPhone
- iPad
- iPod Touch


Read on Flipboard for iPad and iPhone

Featured in the Tech & Science category

Flipboard icon

Twitter Feed
From the Bookstore

Caffeine Poster

The Caffeine Poster infographic

Entries in internet (195)

Wednesday
Jun302010

Google(graphic) - How Google Works


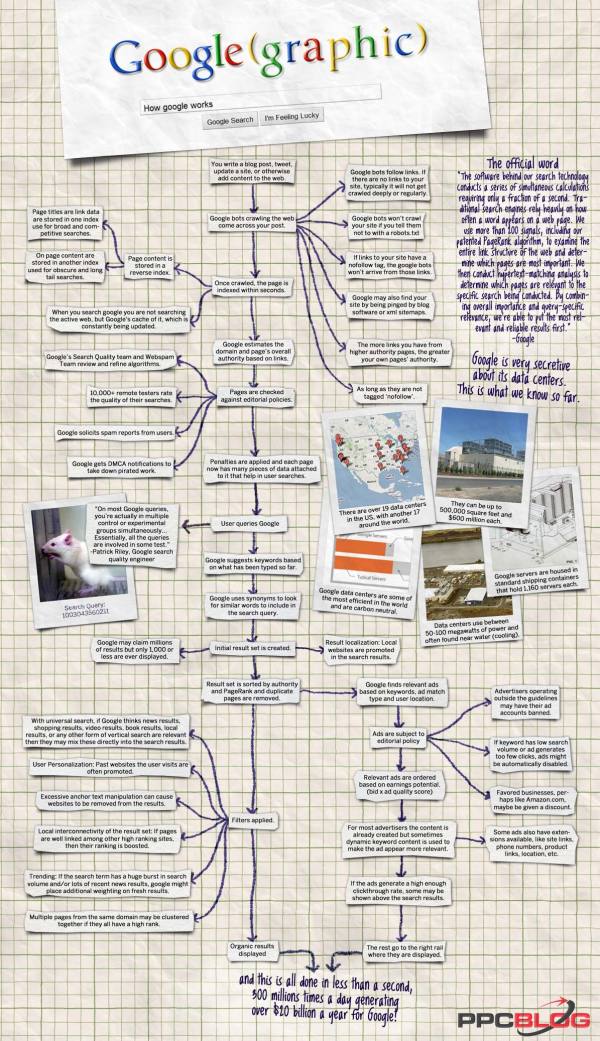
PPCblog.com brings us the Google(graphic) flowchart that documents what happens in the fraction of a second after 300 million people press the Search button every day.  Created by infographic designer Jess Bachman at WallStats.com.

So here is my latest infographic, hot off the press.  How Google Works.  It’s a flow type chart that diagrams the process of how google gets it data and what happens in the second after you search.  It’s a $20 billion a year process for google, and pretty interesting.

Thursday
Jun242010

Google's History of Communication Infographic

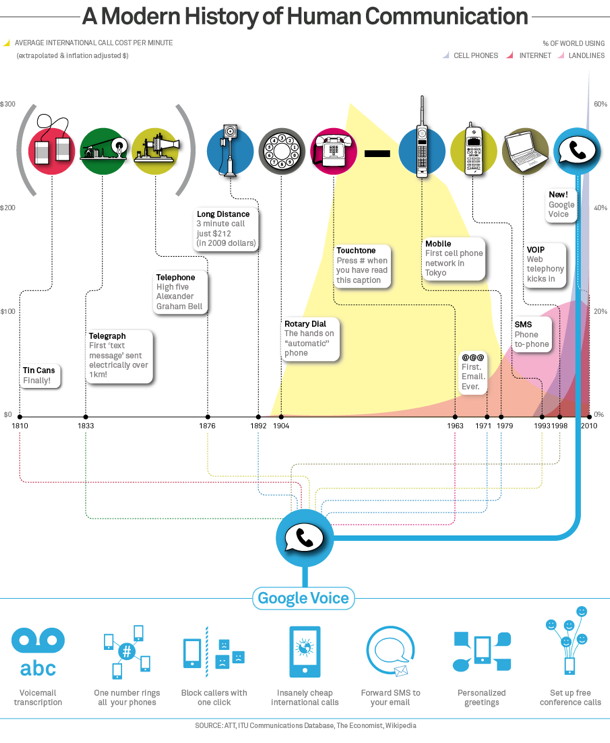
Google posted this infographic, A Modern History of Human Communication, on the Official Google Mobile Blog as part of their opening up the Google Voice service to everyone.  It’s no longer an invite-only service.

To put things in context, we created this infographic to visualize some recent history of human communication and how Google Voice uses the web to help people communicate in more ways than ever before (click the image for a larger version):


Tuesday
Jun152010

InfoChimps Data API BETA program launched!

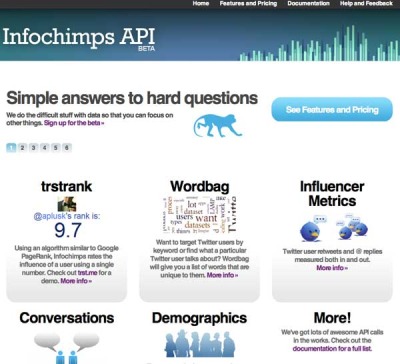
InfoChimps.com has launched the BETA program for the use of their data through InfoChimps APIs.  The two initial data sets are Twitter and U.S. Census data.

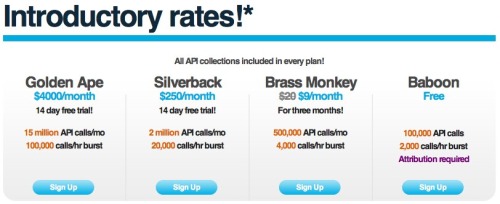
Initial pricing has been announced for this introductory period, and there is a level for FREE access for anyone who want to experiment with the data.

Found on ReadWriteWeb

Tuesday
Jun152010

Are We Addicted to the Internet? (infographic)


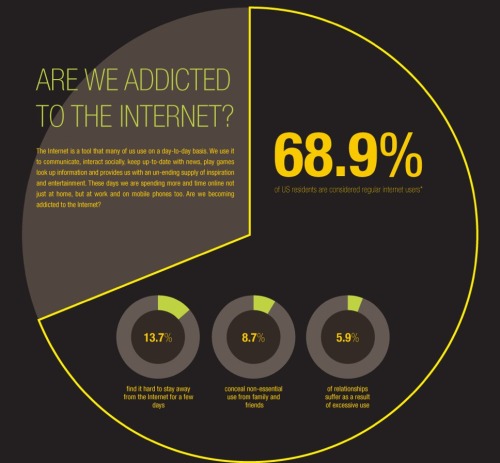
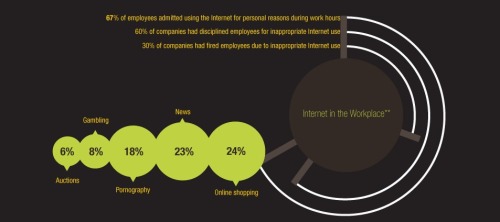
Great new infographic from Flowtown.com, Are We Addicted to the Internet?


While the American Medical Association has yet to officially classify internet addiction as a recognized mental health disorder, the statistics show that this issue is indeed serious – with potentially dangerous side affects. Betweeen 5 % and 10% of web surfers surfers suffer from some form of web dependency.The graphic below illustrates the state of internet addiction, as well as the rapid increase of Internet use in recent year.


Found on Social Media Graphics.


Tuesday
Jun082010

WTF is HTML5 and Why Should We Care? (infographic)

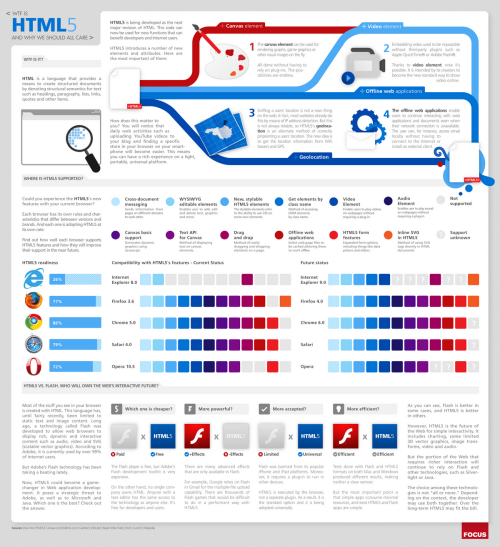
From Focus.com, WTF is HTML5 is a cool visual explanation of HTML5, how supported it is by different browsers and how it compares to Adobe Flash.

From an infographic design view, I don’t like the legend for the color codes in the browser matrix.  I shouldn’t have to look back and forth to figure out what feature is missing from a particular browser.

Thursday
Jun032010

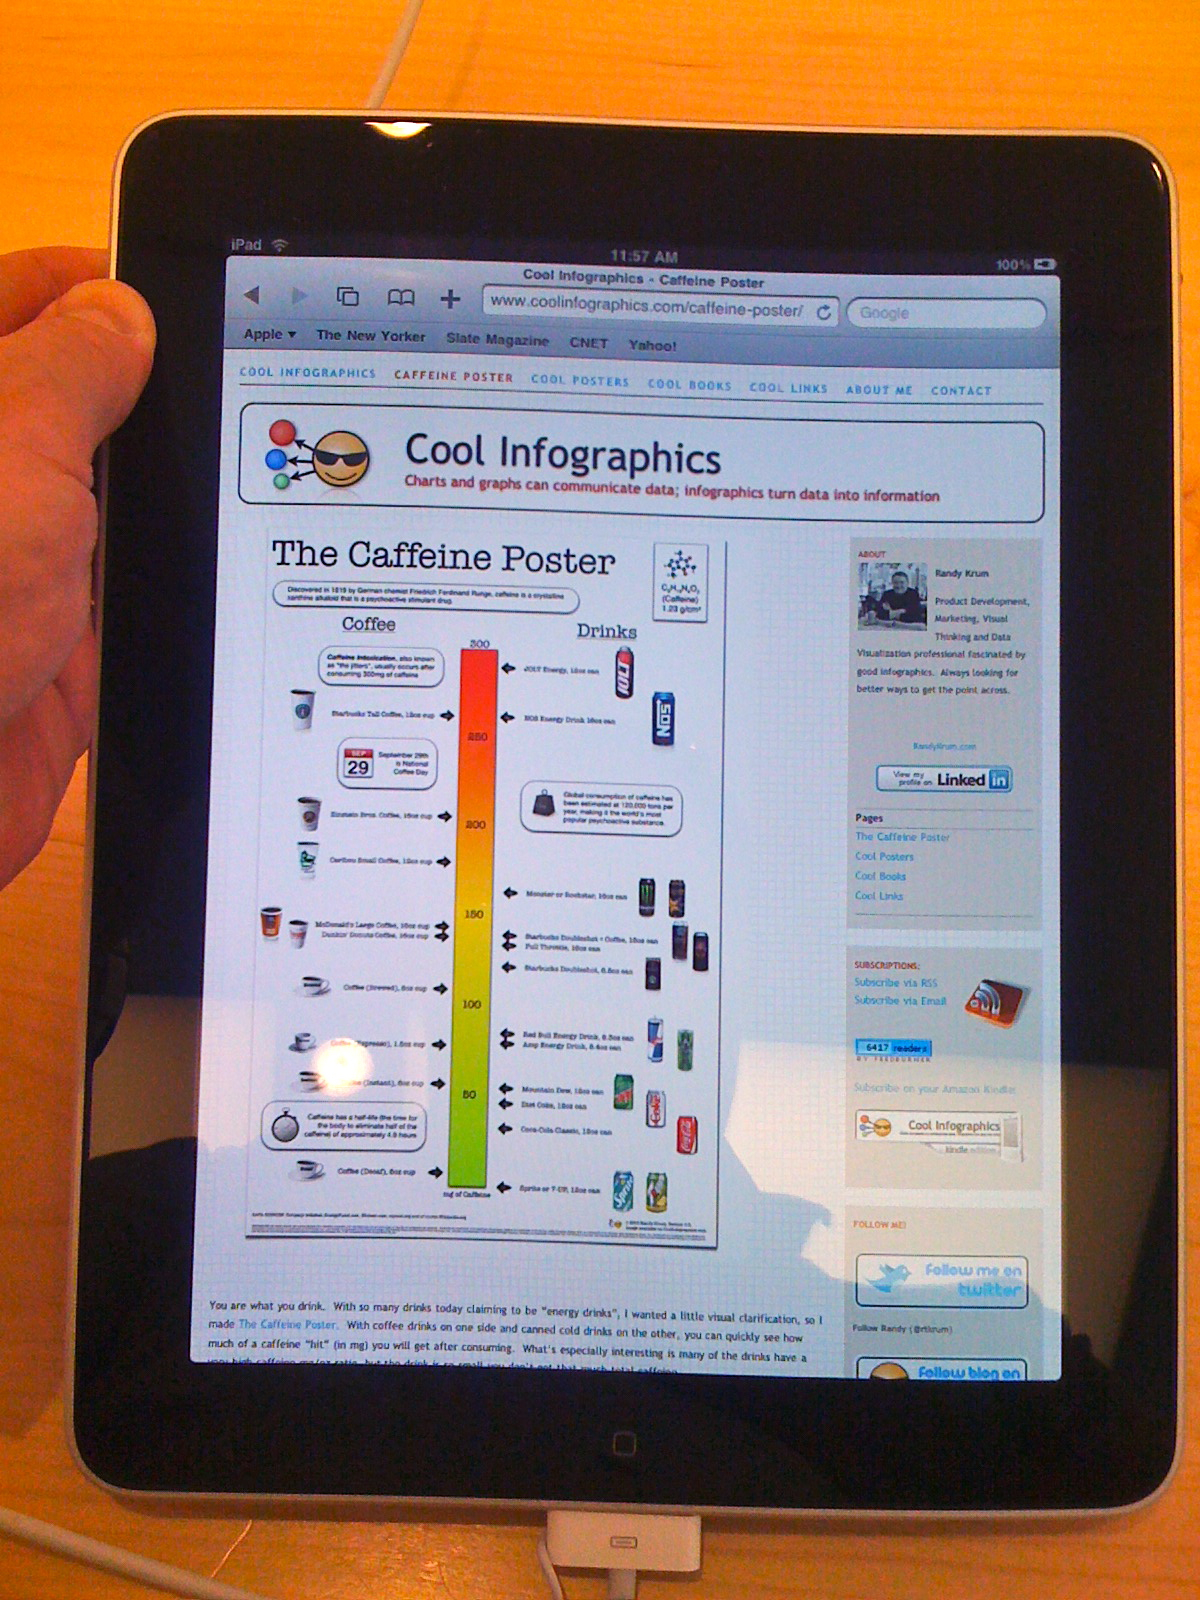
Cool Infographics on an iPad at the Apple Store

At the Southlake Apple Store

I was at the Southlake Apple Store today because the battery in my Black MacBook was dying.  In fact, it was swelling up, getting extremely hot and randomly shutting the MacBook down.  That was a problem.  The laptop is 3 1/2 years old, which it puts it 2 years beyond the AppleCare warranty, so I had to buy a new battery.  The Apple genius told me that usually this type of battery last 260 cycles, and mine had lasted 484 cycles.  Not bad.

While I was there, I had to play with one of the new iPads, and of course had to make sure that Cool Infographics was displaying correctly.  Not only was it displaying correctly, but the display on the iPad makes the blog look amazing!

Here’s how to setup an icon on your iPad, iPhone or iPod Touch for the Cool Infographics blog: (screen shots from my iPhone)
 

Step 1:

View CoolInfographics.com in the Safari app and press the “+” icon at the bottom of the screen.


Step 2:

Press the “Add to Home Screen” button.


Step 3:

Edit the name you want to display, and press “Add”.  (The icon is loaded automatically)


That’s it!  You can move the icon to any of your screens, and always have easy access to the Cool Infographics blog.


Wednesday
May192010

Linux Kernel Zoomable Map

Zoomable map of the open source Linux operating system kernel.  Designed by Constantine Shulyupin.

The Linux Kernel is one of the most complex open source projects. There are a lot of books, however it is still a difficult subject to comprehend. The Interactive map of Linux Kernel gives you a top-down view of the Kernel.

You can see most important layers, functionalities, modules, functions and calls. You can zoom in and drag around to see details. Each item on the map is a hypertext link to source code or documentation.

Thanks to Tobias for sending in the link!

Thursday
May132010

Facebook's Maze of Privacy Settings Infographic

The NY Times just published this infographic tree that shows how complex the privacy settings on Facebook have become.  I’ve got to imagine that Facebook wants the PR credit for giving their users a lot of control over these settings, but then in reality they know that they are so complicated that hardly anyone will take the time figure them out.

It’s astonishing how much of your personal information becomes public if you don’t take the time to figure all of this out.


The ever-increasing complexity of the Facebook Privacy Policy is another example of how complicated the privacy issue is.  It’s a fine line that Facebook has to walk to utilize their members traffic for advertising and respecting their privacy.  It seems to me that advertising is winning.

Found on Fast Company

Monday
May102010

Apple, Adobe Flash and H.264 - an infographic explanation

Enrique Serrano (@eserranocom) designed this tall banner-style infographic, Apple, Flash and H.264, to help explain the conflict between Apple and Adobe Flash.  There’s a lot of history between these two mega-companies, and even after Apple posted Steve Job’s Thoughts on Flash, it’s still not easy to understand what’s going on.

Since so much has been said about not having Flash support in the devices of Apple(mainly the Apple iPhone and the iPad) I put together as much facts as possible about Apple, Adobe, the iPhone and Flash, plus some on video codecs including Theora, H.264 and HTML 5 video.

I hope these infographics help you better understand the big picture with the current situation of these technologies and companies.

Mixing a timeline, bar charts, 100 circles, a couple pie charts and some illustrations, Enrique does a good job of covering most of the angles between Apple and Adobe.

Originally posted on Treble Click, found on Social Media Graphics.

Thursday
May062010

The State of the Internet [infographic]


The State of the Internet is an infographic by Focus.com that shows mostly demographic information about who is on the Internet today.  I really like the “100 Circles” style to show percentages; it’s a far cry better than pie charts or bar charts.  The data is gathered from multiple sources, so it’s nice to see one infographic that shows it all.

Here we take a look at exactly who is using the Internet the most, how they are using it and how much the amount of usage is increasing. At a glance, we can see that there are the same number of men and women who use the Internet. However, their age, educational background and level of income may influence how much time they spend online.