About
Randy Krum
President of InfoNewt.
Data Visualization and Infographic Design

Infographic Design

Infographics Design | Presentations
Consulting | Data Visualizations

DFW DataViz Meetup

Join the DFW Data Visualization and Infographics Meetup Group if you're in the Dallas/Fort Worth area!

Search the Cool Infographics site

Custom Search

Subscriptions:


Feedburner

The Cool Infographics® Gallery:

How to add the
Cool Infographics button to your:

Cool Infographics iOS icon

- iPhone
- iPad
- iPod Touch


Read on Flipboard for iPad and iPhone

Featured in the Tech & Science category

Flipboard icon

Twitter Feed
From the Bookstore

Caffeine Poster

The Caffeine Poster infographic

Entries in internet (195)

Monday
Sep132010

FarmVille vs. Real Farms infographic

Designed by Shane Snow (@shanesnow) for Mashable.com, FarmVille vs. Real Farms takes a look at how the statistics behind the FarmVille phenomenon on Facebook compares to real world statistics about farming.

With all those millions of Facebook and iPhone users tending to virtual crops and sharing them with friends, have you ever wondered how their toils stack up against actual real-life farmers?

How does our output of digital (and decidedly less tasty) tomatoes compare with our worldwide production of real tomatoes? And perhaps most importantly, who are these casual croppers, and are they anything like their plow-toting counterparts?

We broke it down by the numbers and put some of these FarmVille trends in perspective for you.

Found on VizWorld 

Thursday
Sep092010

The Web 2.0 Points of Control Map


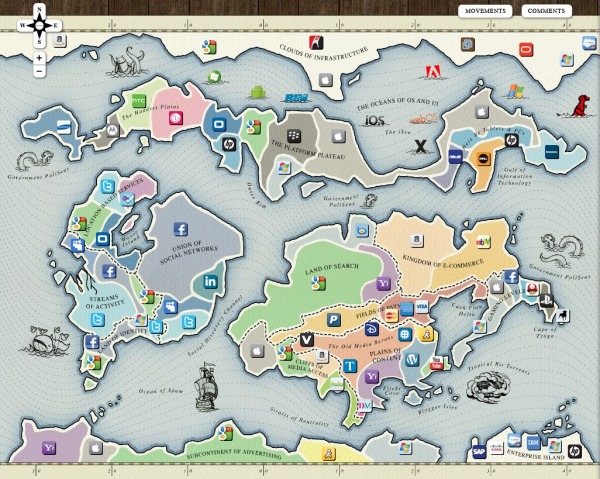
The Web 2.0 Summit Points of Control Map is a very cool, interactive map.  As part of the marketing for the upcoming Web 2.0 Summit (November 15-17 in San Francisco) they have released this interactive map that takes the metaphor of web companies/brands as countries on a map (from xkcd.com and flowtown.com) to a new level.

Pan and Zoom to explore the map, and click the icons to get some insight about each player and their position.

Then, turn on the comments view to discuss the map with others and add your own ideas!


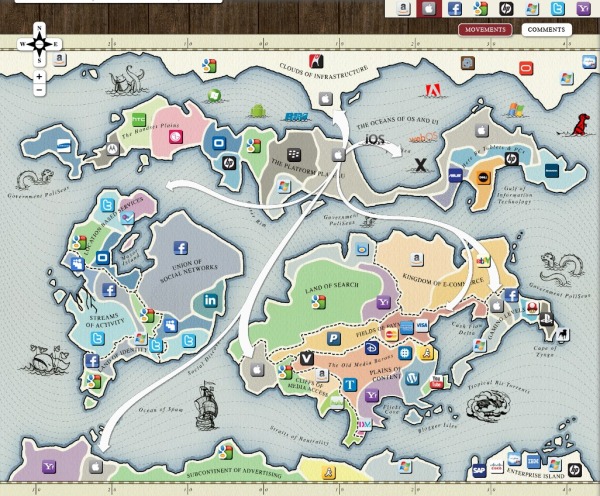
By clicking on any of the company icons at the top, arrows are shown to indicate the business areas (continents) that the companies are trying to expand into (colonize).  You can turn them on one at a time, or turn many of them on at the same time.

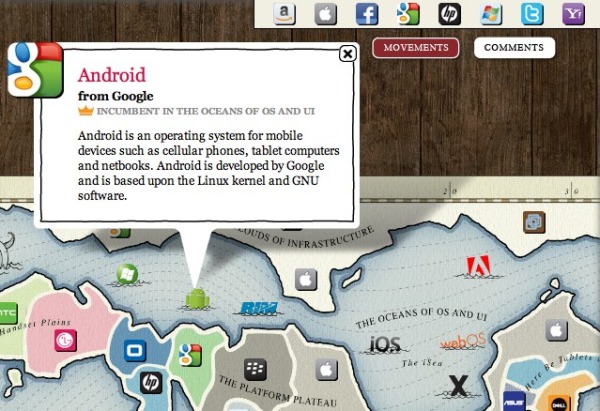
Additionally, you can select any individual icon to get more details:

John Battelle has an in-depth post on the Web 2.0 Summit blog, Points of Control: The Map, about the creation of the map, and his hope that others will add to it in the future.

We’ve put the entire map under a Creative Commons Attribution-NonCommercial-ShareAlike 3.0 Unported License, which means we want you to take this idea and add to it, making it better. Once our amazing development partners at Blend Interactive catch their breath, we also plan to release the code and documentation, so you can create your own maps as well.

Our thanks to the team at Blend who worked with me to bring this vision to reality, and to Janetti Chon, my producer, who kept it on track, and the entire team at Web 2.0 for bearing with us as we brought this first iteration to fruition.

Found on VizWorld.com and VizThink.com 

Friday
Sep032010

The 2010 Social Networking Map


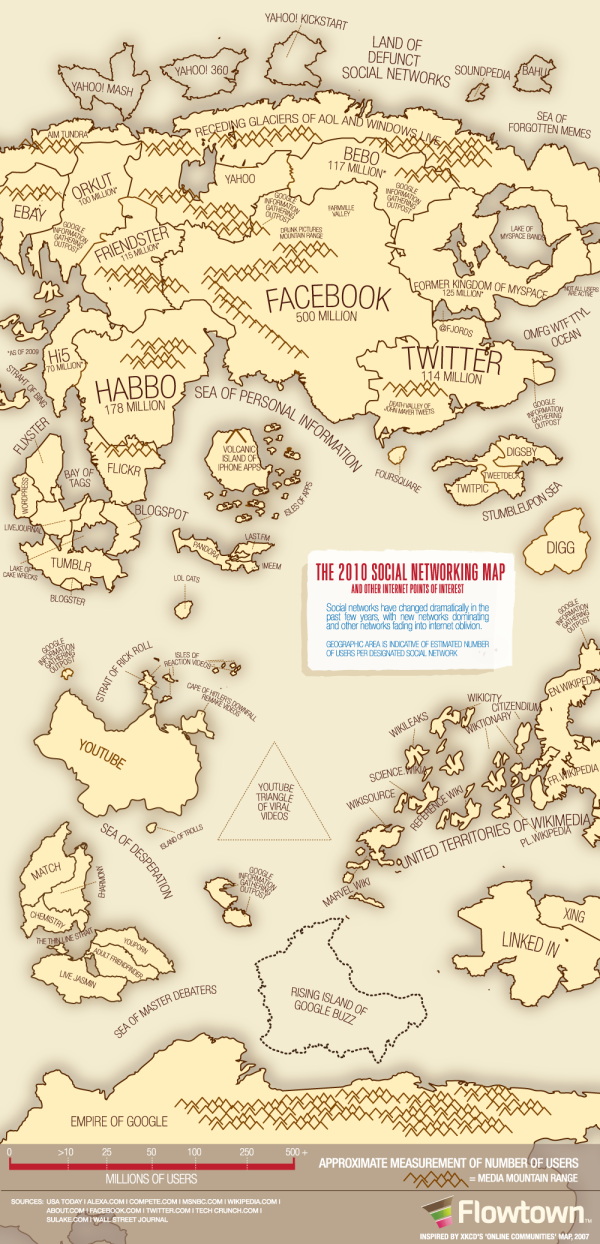
The team at Flowtown.com designed the 2010 Social Networking Map as an update to the Map of Online Communities by xkcd.com in early 2007.  Social networking has certainly advanced in the last three years (even in the last three days!), so the update shows a lot of changes in geography.

It does seem a little premature to claim this is the map of social media for 2010 with five months left to go.  A lot can happen in five months (like the Apple PING service announced this week).

Monday
Aug302010

Icons of the Web

Icons of the Web is a massive image that portrays icons of the top websites on the Internet.  Sizing their favicons based on the site traffic according to Alexa, they were able to get 288,945 good icon images out of the top 1,000,000 sites.

A large-scale scan of the top million web sites (per Alexa traffic data) was performed in early 2010 using the Nmap Security Scanner and its scripting engine.

We retrieved each site’s icon by first parsing the HTML for a link tag and then falling back to /favicon.ico if that failed. 328,427 unique icons were collected, of which 288,945 were proper images. The remaining 39,482 were error strings and other non-image files. Our original goal was just to improve our http-favicon.nse script, but we had enough fun browsing so many icons that we used them to create the visualization below.

The area of each icon is proportional to the sum of the reach of all sites using that icon. When both a bare domain name and its “www.” counterpart used the same icon, only one of them was counted. The smallest icons—those corresponding to sites with approximately 0.0001% reach—are scaled to 16x16 pixels. The largest icon (Google) is 11,936 x 11,936 pixels, and the whole diagram is 37,440 x 37,440. Since your web browser would choke on that, we have created the interactive viewer below (click and drag to pan, double-click to zoom, or type in a site name to go right to it).


You can use the online search engine to locate a particular site icon, and OF COURSE I had to look for the Cool Infographics icon.  Found it!


Programming and design was done by David Fifield and scanning performed by Brandon Enright.

Found on Social Media Graphics

Friday
Aug272010

Google(graphic) - Google's Acquisition Appetite

From Scores.org, a data-heavy Google(graphic) by Jess Bachman, Google’s Acquisition Appetite.  Visualizing almost 10 years of Google’s acquisitions and investments, and there’s hardly a month that Google didn’t invest in something.

I like the multiple dimensions to the data.  Three columns show how the acquisition helped Google, the colors of each acquisition show what assets were gained, an additional circle shows the value of the acquisition (if it is known) and of course the timeline aspect.

Great job Jess!  I’d love to see you keep this updated somewhere.


Tuesday
Jul272010

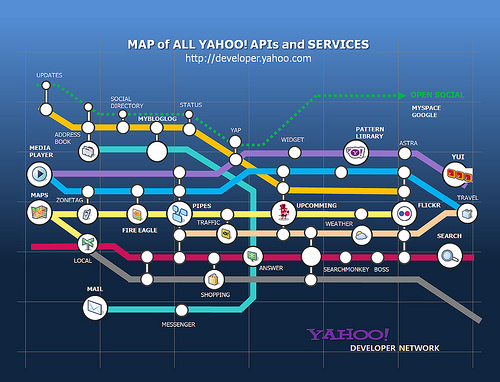
The Yahoo! Developer Network Metro Map

The Yahoo! Developer Network Metro Map is a subway map of the Yahoo! Developer Network of APIs and services by Jinho Jung.

Found on Social Media Graphics

Wednesday
Jul142010

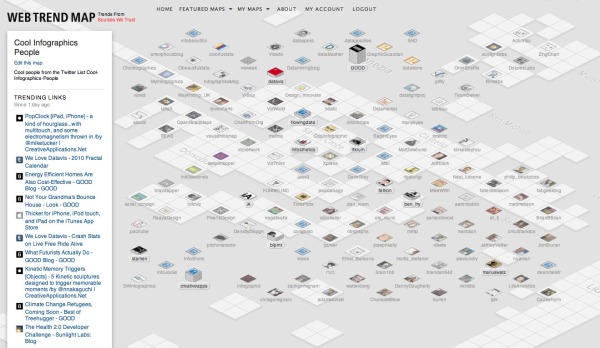
Cool Infographics People on Web Trend Map!

As a visual treat, I took my Twitter list “Cool-Infographics-People” and visualized the entire list on the interactive tool Web Trend Map from iA and Craig Mod.  Visit often, and you can see the hot trends being tweeted that day by some of the best infographics people.

I don’t know how Twitter lists are doing in general, but I know that with 436 followers, the “Cool-Infographics-People” list is one of the most followed lists in the design community.  Out of the 228 lists I’ve been included on, this one is the most followed, and I see that for many other designers too.  I’d love to see (and visualize) the stats from Twitter, but most lists I see have under 10 followers.

Tuesday
Jul132010

Google's Social Media Timeline

From Mashable.com, Google’s Long History of Forays’s into Social Media is a timeline of acquisitions, deals and updates showing Google’s attempts to get involved in Social Media.

Google hasn’t had the best track record when it comes to social media attempts. Rather than a boring old list of past efforts, we decided to put together a graphical timeline with text by our very own Stephanie Marcus and graphics by Shane Snow.

Friday
Jul022010

5 Ways to Cultivate an Active Social Network infographic


5 Ways to Cultivate an Active Social Network is a nice infographic by Mark Smiciklas at Intersection Consulting.  Although not conveying a lot of data, this does a nice job of visualizing the five different activities that Chris Brogan advocates to build and maintain your social network.

This marketing visual was inspired by Chris Brogan. Check out his original post: Cultivate an Active Network.

Thanks to @MarshaCollier on Twitter for tweeting the link.

Friday
Jul022010

The 2010 Internet Censorship Report infographic


From Antonio Lupetti at WoorkUp.com, The 2010 Internet Censorship Report looks at how many people in the world population are effected by government censorship.

It is one of the tools used by governments to filter out unwanted information and to prevent the spread through the World Wide Web. It is a phenomenon of staggering proportions that affects over 25% of the global population.

My suggestion for improvement is that I think the the white circles representing the countries should be sized in accordance the population numbers.

Thanks to Antonio for sending in the link.