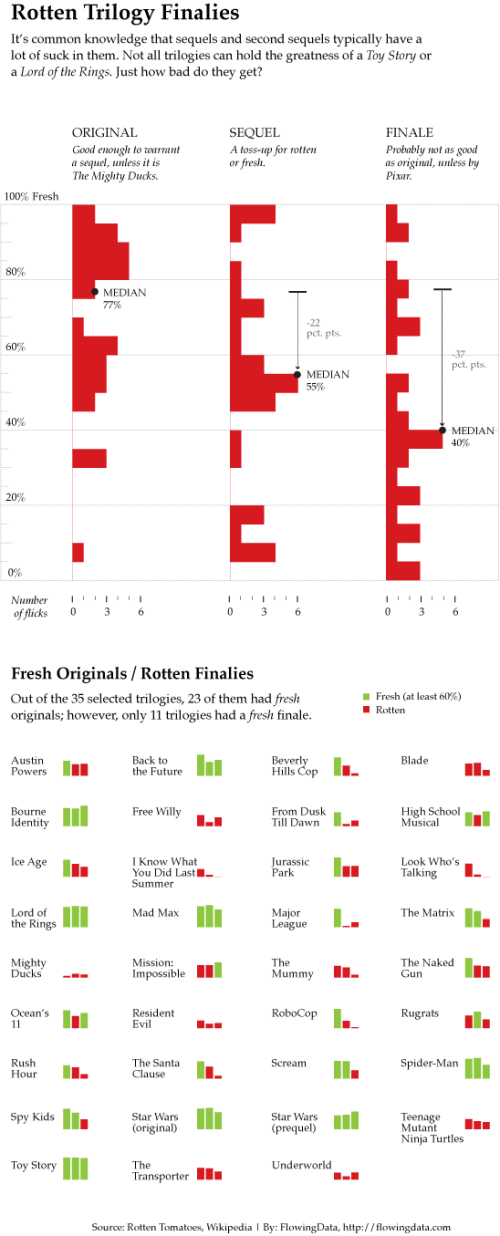
About
Randy Krum
President of InfoNewt.
Data Visualization and Infographic Design

Infographic Design

Infographics Design | Presentations
Consulting | Data Visualizations

DFW DataViz Meetup

Join the DFW Data Visualization and Infographics Meetup Group if you're in the Dallas/Fort Worth area!

Search the Cool Infographics site

Custom Search

Subscriptions:


Feedburner

The Cool Infographics® Gallery:

How to add the
Cool Infographics button to your:

Cool Infographics iOS icon

- iPhone
- iPad
- iPod Touch


Read on Flipboard for iPad and iPhone

Featured in the Tech & Science category

Flipboard icon

Twitter Feed
From the Bookstore

Caffeine Poster

The Caffeine Poster infographic

Entries in movies (48)

Wednesday
Jul072010

Rotten Movie Trilogies Comparison

Nathan Yau from Flowing Data Designed this new underload infographic: Movie Trilogy Comparison.

The third installment of Pixar’s Toy Story is making a killing at the box office (rightfully so, because it’s Pixar-tastic), but not all trilogies have the same luck. They can’t all be Lord of the Rings epics (all over 90% fresh), unfortunately.

Who knew Free Willy was a trilogy?!?


Friday
Jun252010

Timeline for Planet of the Apes

Created by Phil Laver, the Planet of the Apes Timeline of Events covers events across all five of the movies.

The facts and dates recorded here are only those that are generally accepted by POTA statisticians.  No reference to the comics or graphic novels have been given as these follow a substantially alternative timeline.  Tim Burton’s POTA narrative has been similarly ignored.

Phil also had his timeline infographic displayed during an exhibition, you can see a couple photos here.

Thursday
May272010

5 SciFi Movie Quotes...made into infographics

Nathan Yau has designed these humorous infographics representing five famous sci-fi movie quotes for SciFi Wire.

You can see Nathan’s explanation on his website, FlowingData.com, and all of the quotes on SciFiWire.com.  I hope you do more of these Nathan!

In something of a Data Underload, special edition, I played with famous science fiction quotes for Sci Fi Wire. My favorite is obviously from Back to the Future, the greatest movie of all time.

Monday
Apr052010

100 Characters of Pixar infographic

100 Characters of Pixar is a cool scale infographic showing the relative heights and sizes of the characters from the Pixar movies and shorts.  I found a couple of errors, but the idea and execution are great.  I’ve read before that a great character can be recognized in silhouette, and this is a great tribute to the guys at Pixar.

Found on Flickr, the image is designed by Juan Pablo Bravo

Monday
Jan182010

Mega Shark infographic


I love it when someone just decides to create their own infographic.  Stivo (Stephen Taubman) created this Mega Shark infographic to demonstrate the physics behind a giant shark taking down a commercial jet airplane in the movie Mega Shark vs. Giant Octopus.

Last year, I discovered the wonderfully cheezy and sharky movie: Mega Shark Vs. Giant Octopus. While it certainly appealed to a more straight-to-DVD niche market of creature-feature enthusiasts, it wasn’t half bad. Pretty laughable in parts…well actually, in most parts when you consider the wooden acting and crap computer animation. However the most ridiculous scene has to be when Mega Shark takes down a commercial jetliner that is cruising over the middle of the ocean. It was this moment that took the movie from being a little ho-hum to “holy shit, did that shark just eat a plane!?”. Check out the clip for yourself on youtube here.

It’s pretty incredible when you think about it. I mean, how the hell did it do that? What would it require for a shark the size of a plane to launch itself out of the water and take down a moving aircraft? After reviewing some of my basic physics calculations (thanks SUVAT!) I came up with some pretty startling figures. However, it didn’t feel like I would be doing such an epic event justice with just a basic blog post, which meant it was time to do what I love most: an infographic! I had been itching to do one for a while now, and this seemed like the perfect opportunity. So with all that said, check out the resulting design below. Oh, and just click on the image to download the full size PDF version for the smaller details.


Great job Stivo!

Wednesday
Nov042009

XKCD: Movie Narrative Charts


Great post by the XKCD online comic series!  They occasionally post a infographic-style piece, and this one doesn't disappoint.

Created by Randall Munroe at XKCD, the Movie Narrative Charts plot the interactions between key characters on a timeline, grouping the character lines together when they are interacting in the movies.  He obviously spent some time working on these, and be sure to check out the detail in the full size version.


The last two are jokes, but the ones for Lord of the Rings, the original Star Wars Trilogy and Jurassic Park are real and very well done.  I love the Primer chart poke at trying to follow the movie!  Not as mainstream as the other movies, but it's definitely appropriate.  I'd love to see how Randall would chart Memento!

Thanks Tom for the email link!  Popular on the blogs, this was also found on Infothetics, FlowingData, SimpleComplexity, VizWorld and Fast Company.

Wednesday
Sep302009

Best Films of All Time Infographic


Designed by David Honnorat for Vodkaster.com, this subway-style map uses film genres as the different colored lines (i.e. comedy, action, drama, science-fiction, etc.).

Found on FastCompany.com

Wednesday
May062009

Bestselling Movies are Not the Most Pirated Ones Online

Posted by metrobest on Flickr, a cool infographic showing that the most pirated movies on the web are not the bestselling, blockbusters you might expect.  Not sure who the author is, but it may be "5W Infographics EspaƱa"

Check out the other posted infographics while you're there.

Page 1 ... 1 2 3 4 5