About
Randy Krum
President of InfoNewt.
Data Visualization and Infographic Design

Infographic Design

Infographics Design | Presentations
Consulting | Data Visualizations

DFW DataViz Meetup

Join the DFW Data Visualization and Infographics Meetup Group if you're in the Dallas/Fort Worth area!

Search the Cool Infographics site

Custom Search

Subscriptions:


Feedburner

The Cool Infographics® Gallery:

How to add the
Cool Infographics button to your:

Cool Infographics iOS icon

- iPhone
- iPad
- iPod Touch


Read on Flipboard for iPad and iPhone

Featured in the Tech & Science category

Flipboard icon

Twitter Feed
From the Bookstore

Caffeine Poster

The Caffeine Poster infographic

Entries in relative (157)

Tuesday
Mar242009

The Trilogy Meter


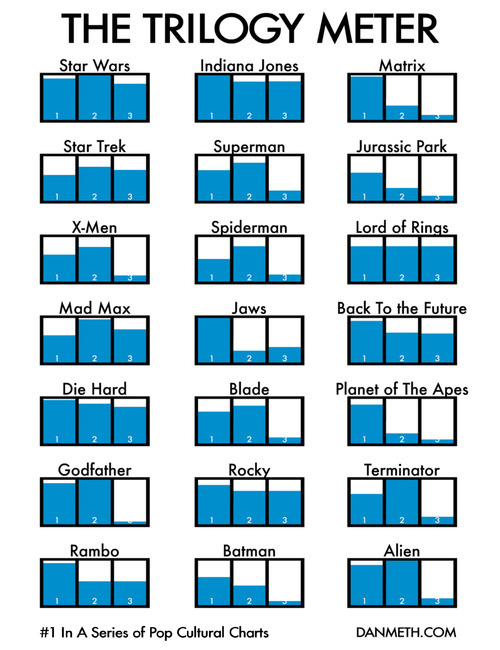
Dan Meth did a great job creating his own personal Trilogy Meter showing his personal enjoyment of movies released as a trilogy.  This shows that Dan never likes the 3rd movie as much, so he should just stop spending the money.

Although this is based on Dan's personal ratings for each movie, there's no reason why something like this couldn't be done with more official data like critic ratings or box office dollars.

Thanks for the link Jesper and Daniel!

Monday
Mar232009

Planets, a Solar System Visualizer


Check out Planets, an interactive solar system visualizer.  It lets you change the focal point so you can see the planetary motions as if you were standing on any of the planets.  A great way to understand retrograde motion.

Thanks Paul, for the link.

Tuesday
Mar172009

Bad News for Newspapers


Infographic from the NY Times (I know, ironic isn't it?) that shows the drop in circulation of major newspapers across the U.S.
Heavy debt has dragged several newspaper companies into bankruptcy. The industry’s dwindling revenues have forced some money-losing papers to close, and papers that are for sale are having trouble finding buyers. Experts say that before long, a major American city could be left without a daily paper. (Related Article)
Found on Twitter from @edial

Wednesday
Mar112009

What's In Your Mail?


From Deliver Magazine (Issue 24, Page 7), has a simple infographic that clearly breaks out what’s in your average mail delivery in the U.S.  The illustration is by Jude Buffum.  Its available here as a PDF.


Source: USPS® Household Diary Study: Mail Use and Attitudes, FY 2007


Wednesday
Mar042009

F1 Racing Car Changes Video

Great animated video the visually shows you the changes in the F1 racing cars for 2009.

A fantastic computer-animated clip features Mark Webber and Sebastian Vettel racing on track, as they bring to life the biggest rule changes in the history of Formula One.  Last seasons car morphs into the current Red Bull Racing car, the RB5, showing all the bodywork changes from nose to rear wing.
From www.automotivetv.net

Monday
Mar022009

Taking the Train

It's not a complicated one, but I like Good Magazine's summary of the biggest train systems in the world (top 5 U.S. cities and top 5 foreign cities).  The silhouettes represent the daily rides in the city, and the length of the train shows how many miles that system covers.  To the right is a quick map of each city's subway system and some statistics about their subway system.

Thanks Li, for sending in the link!

Wednesday
Feb252009

Taking Apart the $819B Stimulus Package

Very detailed infographic from the Washington Post showing how the proposed stimulus package is broken out between ares of spending and tax cuts.

The centerpiece of President Obama's domestic agenda is an $819 billion economic stimulus plan. The Senate will consider the measure this week, with an eye toward the amount of tax cuts and spending. Republicans and Democrats spar over what to consider a tax cut. An analysis by the nonpartisan Congressional Budget Office tallies the tax-cut portion to be significantly less than the one-third Democrats claim it to be.

SOURCE: Congressional Budget Office | Reporting by Karen Yourish, graphic by Laura Stanton - The Washington Post - February 01, 2009

Wednesday
Feb042009

One Month of Spam


From TimGraham.net, Tim plotted out some statistics about all of the spam email he received in February 2008. 

Tim, only 208.5 spam emails a day?  You need to get your email address out into more public places!

Thanks for the link Alwyn!

Wednesday
Jan282009

The Ultimate Mammal Family Tree


This is very cool.  Going back 166 million years to see each of the branches where we share common mammalian ancestors.  The PDF is available for download, and is very detailed.  You need to zoom a long way to even see that there is text naming each of the known mammals in existence today.  It's a radial family tree that also represents a timeline as you move outwards from the center.  Here we are:


ABC TV in Australia did a short video on the family tree hosted by Dr. Paul Willis, and he literally walks around the infographic describing different parts.  Well done, and seemed very reminiscent of Carl Sagan in some of his shows.  The video credits Robin Beck, a Mammalian Systematist as the University of NSW, of creating the family tree.  Here's the link to the ABC page where you can watch the video, or you can click on the image below.


Thanks for the link Alwyn!  Great find!

Friday
Jan232009

Why Do Freeways Come to a Stop?


This is a simple, good infographic that seeks to explain why traffic on freeways slows to a crawl without any apparent reason to drivers.  By Stephen J. Beard and Rich Exner in The Plain Dealer.

EDIT: Here's a link to the original article, and a high-res PDF of the infographic.

Page 1 ... 6 7 8 9 10 ... 16 Next 10 Entries »