About
Randy Krum
President of InfoNewt.
Data Visualization and Infographic Design

Infographic Design

Infographics Design | Presentations
Consulting | Data Visualizations

DFW DataViz Meetup

Join the DFW Data Visualization and Infographics Meetup Group if you're in the Dallas/Fort Worth area!

Search the Cool Infographics site

Custom Search

Subscriptions:


Feedburner

The Cool Infographics® Gallery:

How to add the
Cool Infographics button to your:

Cool Infographics iOS icon

- iPhone
- iPad
- iPod Touch


Read on Flipboard for iPad and iPhone

Featured in the Tech & Science category

Flipboard icon

Twitter Feed
From the Bookstore

Caffeine Poster

The Caffeine Poster infographic

Entries in scale (154)

Wednesday
Dec242008

The Tallest Building: Burj Dubai


The Burj Dubai is a construction project to build the world's tallest building in Dubai.  Their website has a nice interactive comparison to the other key skyscrapers in the world.  The photo-like images on a black background with the reflection is very similar to the Apple Computer photo slideshows.
The goal of Burj Dubai is not simply to be the world's highest building.  It's to embody the world's highest aspirations.  Burj Dubai looks different depending on where you're standing.  For those living nearby, it is a shining accomplishment - tangible proof of Dubai's central role in a growing world.
Thanks Alwyn!

Tuesday
Dec232008

Immigration to the U.S. 1820-2007


Immigration to the US, 1820-2007 v2 from Ian Stevenson on Vimeo.

Cool video by Ian Stevenson (hosted on Vimeo) that animates the origins and number of people that immigrated to the U.S. every decade from 1820 to 2007.

Thanks Garrett for the link!

Monday
Dec152008

Ben Fry's Zipcode Project


Ben Fry is the author of Visualizing Data, and describes the ZipCode project in his book.  Each dot on the map is one zip code, and as you type a zip code, it highlights all of the dots that share that portion of the zip code.  You can turn on the "zoom" feature that zooms farther into the map for each digit you add.

This is built with the open source Processing tool that was recently released to the world as version 1.0.

Here are all of the zip codes that start with "6"


Thanks Steve for sending the link!

Here's a link to Ben's book on Amazon:

Friday
Dec052008

The Species-Scape

Christopher Taylor posted this image on his Catalogue of Organisms blog, and it has raised a little controversey about the details.  The intent is that the relative size of each organism in the image is representative of the number of species in that group.  So the large fly represents the huge number of insect species.  Towards that intent, I believe the image succeeds, but I have read some disagreement about the specific numbers used to develop the image.

In case you're wondering where the mammals are, we're represented by the reindeer cowering underneath the mushroom.

Two very similar images with some differences are also available.  One from the University of Sydney:

And another on from Cornell University: (this link wasn't working for me)

No matter which is exactly correct (and there's no way to tell), you get the point how small number of species of mammals are compared to the others.

Thanks Kevin, for sending in the link!

Wednesday
Oct292008

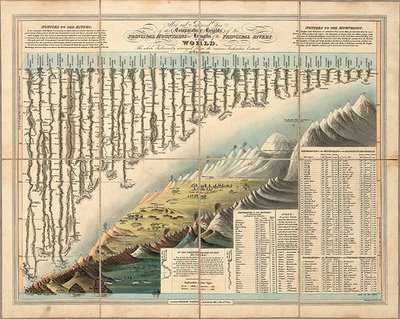
Classic infographic from 1823!


Here's a classic from 1823!  It a hand drawn infographic titled "Comparative Heights of the Principal Mountains and Lengths of the Principal Rivers of The World" by WR Gardner.  The high resolution image is on Flickr, but the post about the image is on bibliodyssey.blogspot.com.

This one makes a great poster!  Thanks Roi for sharing in the comments.

Wednesday
Oct222008

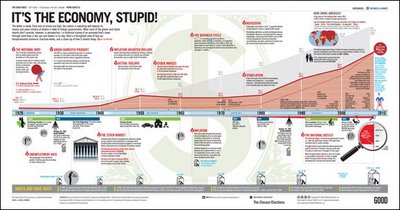
It's the Economy, Stupid!


Great timeline from GOOD Magazine (via picdit.com).
What most of the doom-and-gloom reports on our economy don’t provide is perspective—a historical survey of an economy that’s been through more than a few ups and downs in its day. Here’s a farsighted view of how our temperamental economic machine works, and a close-up of how it stands today.
Thanks Adam!

Monday
Oct202008

NEW Death and Taxes 2009 poster


New Death and Taxes infographic for 2009!  Interactive viewer let's you zoom in to see all of the details.
"Death and Taxes:2009" is a representational poster of the federal discretionary budget; the amount of money that is spent at the discretion of your elected representatives in Congress. Basically, your federal income taxes. The data is from the President's budget request for 2009. It will be debated, amended, and approved by Congress by October 1st to begin the fiscal year.

The poster provides a uniquely revealing look at our national priorities, that fluctuate yearly, according to the wishes of the President, the power of Congress, and the will of the people. If you pay taxes, then you have paid for a small part of everything in the poster. 
The Death and Taxes poster from 2007 was my initial post on Cool Infographics, so I'm very excited to see this update.  Now the 2009 version is available to purchase as a poster here.

Thursday
Oct162008

Brand Tags


BrandTags.net is a project by Noah Brier that gathers user input to create tag clouds for many of the biggest brands in our culture.  You can add your own input into the project on the main page, or browse brand results.  The example above is for Velveeta.

Thursday
Oct092008

Watercube, The Book


Watercube, is a new book by Ethel Baraona Pohl.  The book is about the National Aquatics Centre built in Beijing for the 2008 Olympics, and has some cool infographics inside.  Some of the graphics were contributed by architect César Reyes Nájera.  A review of the book can be found here on www.v2com.biz
WATERCUBE: The Book is a complete monographic publication about the National Swimming Center for the Beijing Olympics 2008. With an exhaustive description about the Watercube we present a detailed study of the project. The book makes an holistic approach to the project that starts with a brief description of urban and social changes that China has been experienced in the last decade. These facts have encouraged the construction boom that made possible these kind of projects occur in cities like Beijing.

 
This page compared the amount of steel used to built the Watercube to some of the most well known buildings around the world.
This page shows a comparison to the same set of buildings around the world, but shows the tons of CO2 produced due to the steel used in their construction.


This page is one of the years of the timeline leading up to the construction of the Watercube.

Here you can buy Watercube, by Ethel Baraona Pohl, on Amazon.com.

Special thanks to Ethel for sharing the images from her book, and allowing me to post them on Cool Infographics!

Tuesday
Oct072008

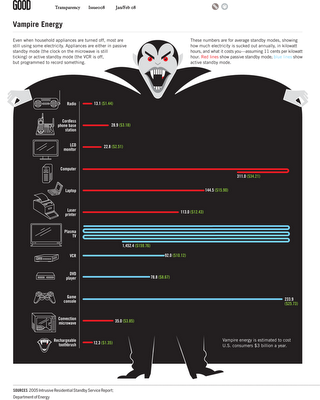
Vampire Energy infographic video & chart

From GOOD magazine, they created an infographic video about Vampire Energy, all of the energy used by electronics in your house while you are not actively using them.  The chart itself from the magazine is fairly simple chart, but I really like it.  It's effective getting the message across with simple graphics.