A Visual History of the American Presidency - new infographic poster
Timeplots has released their second infographic poster, A Visual History of the American Presidency. Timeplots was launched by Nathaniel Pearlman and Frank Hamilton in December 2009 with the release of the Visual History of the Supreme Court infographic poster, which is now hanging in many schools, law practices and political offices.
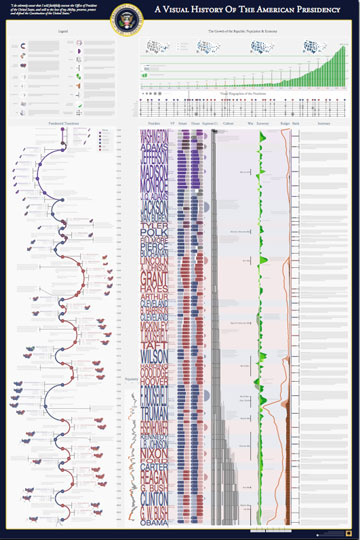
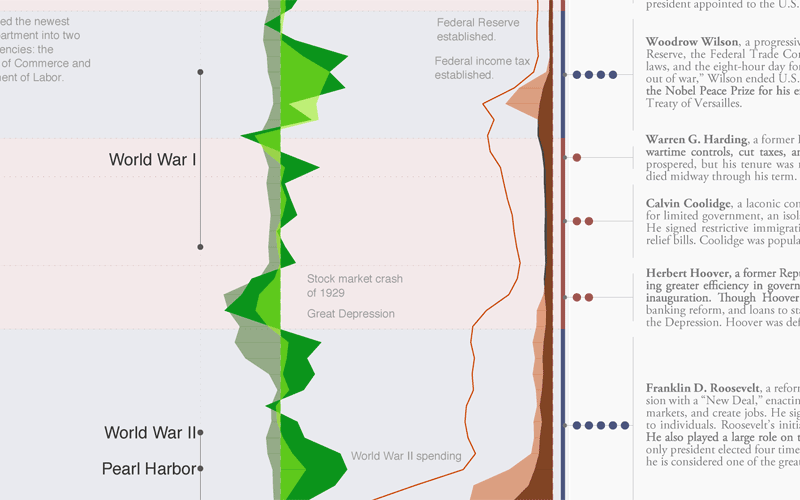
This large-scale print is like nothing else available on the history of the American presidency. It places each president in historical context, visualizing a remarkable range of political, social, and economic measures to succinctly tell the story of the presidency. Narratives are displayed within the larger context of American political history by aggregating and annotating hard data on population, presidential elections, Congress, the Supreme Court, the Cabinet, the U.S. economy, and the federal budget and debt. The Timeplot provides a new lens into American political history; it is not intended to be absorbed at a glance, but rather to be visited and revisited over time.
A beautiful poster, and a very impressive infographic design. Very Tufte-like in its infographic design, which is no surprise since Nathaniel was a student of Edward Tufte at Yale.
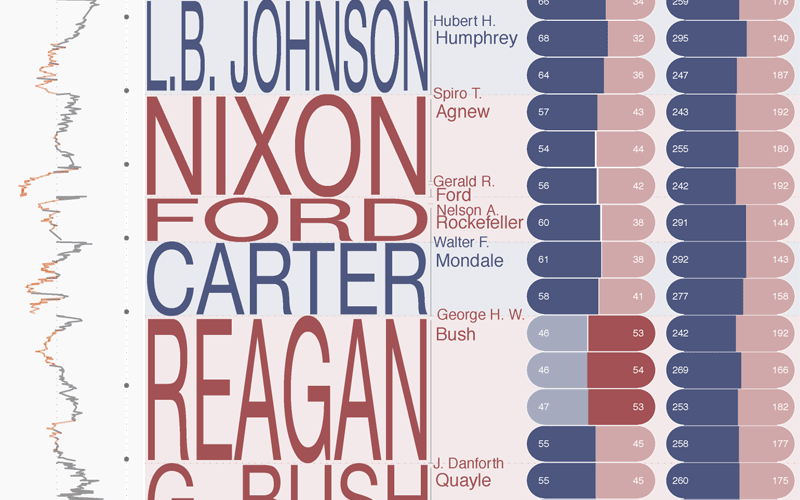
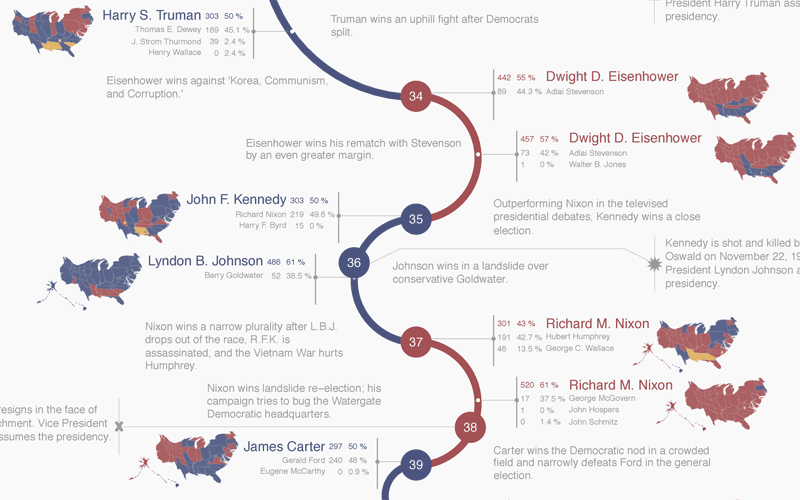
At its heart, this is a fantastic mix of timelines. Additionally, the poster is an incredibly detailed infographic that includes things like the time period of each President, the balance of Congress during each term, approval ratings, population growth, the U.S. GDP, the Federal Budget, unemployment, election cartograms and statistics, a biography of each President’s political history and so much more.
The high-resolution infographic is available on the Timeplots site using Zoomify, but it really shines as the printed poster. You can order the printed 32”x48” poster from the Timeplots.com site for $45, or a smaller 24”x36” version for $30.
Great job to the entire team at Timeplots! Later today, I’ll post a behind-the-scenes interview with Nathaniel.
 connections,
  design,
  history,
  politics,
  poster,
  presidential,
  timeline


Reader Comments (2)
very nice way to show American presidency.
really i like this way .
http://www.cosmeticsurgerytoday.com/breast-augmentation/
A typical look at does reflects your wealth, status and ability..