About
Randy Krum
President of InfoNewt.
Data Visualization and Infographic Design

Infographic Design

Infographics Design | Presentations
Consulting | Data Visualizations

DFW DataViz Meetup

Join the DFW Data Visualization and Infographics Meetup Group if you're in the Dallas/Fort Worth area!

Search the Cool Infographics site

Custom Search

Subscriptions:


Feedburner

The Cool Infographics® Gallery:

How to add the
Cool Infographics button to your:

Cool Infographics iOS icon

- iPhone
- iPad
- iPod Touch


Read on Flipboard for iPad and iPhone

Featured in the Tech & Science category

Flipboard icon

Twitter Feed
From the Bookstore

Caffeine Poster

The Caffeine Poster infographic

« Our World Ski Calendar – Seasonal Ski Resorts around the World | Main | The Monstrous Cost of Work Failure »
Friday
Sep062013

Visualizing the Microsoft-Nokia Deal

Visualizing the Microsoft-Nokia Deal
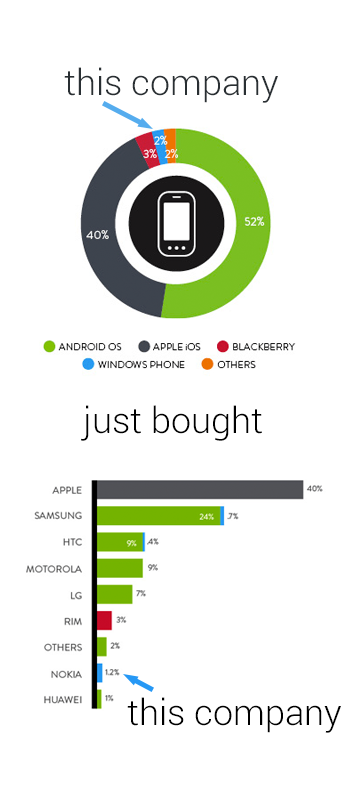
Good data visualization uses visuals to put data into context for the readers, making the information easier to understand.  This simple infographic takes a couple charts previously published by Nielsen, and uses them to provide context to the news story of Microsoft acquiring Nokia’s handset devices unit for $7.2 Billion.

Combining data visualization with text and images should make the information easier and faster to understand, and this design does a great job.

Designer unknown.  Thanks to Mike Elgan for posting on Google+ and Luke Millar (@ltm) for posting on Twitter.

PrintView Printer Friendly Version

EmailEmail Article to Friend

Reader Comments (1)

Very nice post
September 10, 2013 | Unregistered Commenterserge
Editor Permission Required
While we are migrating to a new site design, you must have editing permission for this entry in order to post comments.