About
Randy Krum
President of InfoNewt.
Data Visualization and Infographic Design

Infographic Design

Infographics Design | Presentations
Consulting | Data Visualizations

DFW DataViz Meetup

Join the DFW Data Visualization and Infographics Meetup Group if you're in the Dallas/Fort Worth area!

Search the Cool Infographics site

Custom Search

Subscriptions:


Feedburner

The Cool Infographics® Gallery:

How to add the
Cool Infographics button to your:

Cool Infographics iOS icon

- iPhone
- iPad
- iPod Touch


Read on Flipboard for iPad and iPhone

Featured in the Tech & Science category

Flipboard icon

Twitter Feed
From the Bookstore

Caffeine Poster

The Caffeine Poster infographic

Entries by Randy (1654)

Friday
Sep282007

The Wine Advocate Vintage Guide
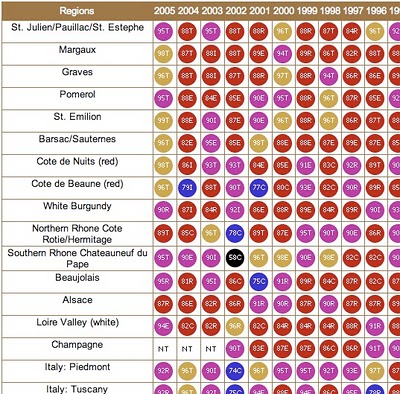

From eRobertParker.com, the online Wine Advocate Vintage Guide. Fascinating guide of wines from 1970-2005. Wines are grouped by region and year, and each group is scored and given a letter code to identify the current maturity status of those wines (like Ready to Drink, Too Old and Early Maturing). The color coding represents ranges of the numeric scores.

The guide is interactive, so clicking on any of the rating circles brings you to a list of the specific wines grouped together for that region. For the specific wines, you can see their individual name, score, maturity level and price range.

A PDF version of the guide is available here for download.

Friday
Sep282007

Travel Time Maps


From mySociety.org, time travel maps take into consideration the means of travel (car, rail, etc.) and the different paths available. Above is a map of London and shows time to travel from the center of town. The white contour lines represent half hour intervals, and the color coding has warm colors for the shortest times, and cool colors for the longest times.

The really interesting feature are the "islands". These small circles represent destinations that you can reach much faster than the surrounding area. Mainly stations for faster trains than have fewer stops.

Strangely similar in concept to an "event horizon".

Thursday
Sep272007

Shanghai Urban Planning


Last year I was in Shanghai, China on business. A friend suggested we visit the Shanghai Urban Planning building, and the first thing I thought was "ohhh, I bet that's exciting...not". But, he convinced us to give it a try, and here are a few photos I took.

On the top floor of this building is the largest model of urban planning in the world. For an American, seeing Shanghai is a shock at how large the city is, and how many skyscrapers there are. For reference, Shanghai's population is about 22 million people, compared to about 8 million in New York. Most U.S. cities have a "downtown" type area where the most skyscrapers are clustered, but Shanghai is a city of skyscrapers everywhere.

The World Population Map is one way to understand the scale difference between the U.S. and China, but this model city is astounding. Even better than riding around town (you definitely don't want to be the one driving), the model city really drives home the scale of Shanghai, and what has been accomplished in urban development. The model is built at 1:2000 scale.


Those are the building support columns in the middle of the model, NOT some new super skyscraper!

Monday
Sep242007

History of Computer Languages


O'Reilly has created a poster showing the 50-year history of computer languages from 1954 to 2004, available as a PDF. They have also been giving away copies of the posters at O'Reilly conferences. I love the links shown where older languages split or combined to create the newer languages over time.

I look back around 1990 when I was programming in college and see Fortran V, C++ and the birth of Visual Basic. I remember having to convince my engineering professors to let me program assignments in C++ instead of Fortran.

The original diagram was created by Éric Lévénez. Although O'Reilly is not updating the poster, Eric is keeping his original diagram up to date on levenez.com.

Monday
Sep242007

31 Days in Iraq

This map of Iraq from the NYTimes.com visually shows the over 1,900 people killed in Iraq during the month of January 2007.

"The map, based on data from the American, British and Iraqi governments and from news reports, shows the dates, locations and circumstances of deaths."
The number has doubled since they did this for January 2006 which had around 800 deaths. Each figure represents an individual of the American forces, coalition forces, Iraqi forces, police officers or civilian death. The larger figures have numbers showing how many people they represent (which I think diminishes the visual impact). A smaller icon shows the cause of death. All the figures are connected to a location in the country.

I would have added some color coding too, but I'm guessing the NY Times had to keep it in black & white to print it in the newspaper.

Saturday
Sep222007

Earth At Night


This satellite photo from NASA spans a 24-hour period showing the entire surface of the Earth in darkness. The lights obviously show the highest areas of concentration of civilization.

Note the Nile River delta, the Siberian Express railway route, the Australian coastal cities, and Africa, literally "the dark continent".
From Princeton's International Networks Archive, the old project of Jonathan Harris.

Friday
Sep212007

AT&T: A History


In 1984, the government broke up "Ma Bell" as a monopoly. Since then it has slowly be pulling back together. This infographic really puts all the pieces back together in a simple way that you understand immediately. Kind of like a free-form timeline, instead of the traditional, left-to-right timeline visual. The AT&T brand name is still so strong, Cingular chose to rename all of their stores AT&T after their recent merger.

Found on FreePress.net

Wednesday
Sep192007

The inner mind of a brand geek


A subject near and dear to my heart, I found this poster on Visual Complexity. This map "illustrates the intricate, interwoven relationship between businesses and their brands." The source appears to be 300million.com, which is a Marketing agency in the UK.

I love this map, and I thought this would be a good entry to the VizThink Mind Map Contest.

Tuesday
Sep182007

Bed Sheets for Couples


My wife got the biggest laugh out of these. Found on Information Aesthetics, these double bed sheets are printed with a ruler starting at the center and measuring outward. You can always tell whose side you're on because the ruler is printed to be read when you are in the bed.

The sheets are from DesignWise, a store chain with designer products in Portugal, Spain and France. DESIGNWISE is a brand that edits original products and objects created by Portuguese designers.

Tuesday
Sep182007

Speedtest.net


Speedtest.net does a great job showing you the data while testing your own internet connection speed. From locating a test server on the map, to animating the speedometer as the test runs. Without much text at all explaining what's going on, you understand the test, and the results.

Then you get the code to embed your results (see below) into a blog post, email or website. How fast is your connection?