About
Randy Krum
President of InfoNewt.
Data Visualization and Infographic Design

Infographic Design

Infographics Design | Presentations
Consulting | Data Visualizations

DFW DataViz Meetup

Join the DFW Data Visualization and Infographics Meetup Group if you're in the Dallas/Fort Worth area!

Search the Cool Infographics site

Custom Search

Subscriptions:


Feedburner

The Cool Infographics® Gallery:

How to add the
Cool Infographics button to your:

Cool Infographics iOS icon

- iPhone
- iPad
- iPod Touch


Read on Flipboard for iPad and iPhone

Featured in the Tech & Science category

Flipboard icon

Twitter Feed
From the Bookstore

Caffeine Poster

The Caffeine Poster infographic

Entries in art (93)

Friday
Dec182009

Word Spectrums! The Online Infographic Battleground


On Chris Harrison's site, there are a number of graphics that he calls Word Spectrums.  More like a battleground, Chris is using the enormous amount of data from websites that has been made public by Google.  This is an advanced form of a word cloud that visualizes related words and their relative connections to the two topics.  (FYI, since this is based on raw Google data, foul language does appear in some of them).


Using Google's enormous bigram dataset, I produced a series of visualizations that explore word associations. Each visualization pits two primary terms against each other. Then, the use frequency of words that follow these two terms are analyzed. For example, "war memorial" occurs 531,205 times, while "peace memorial" occurs only 25,699. A position for each word is generated by looking at the ratio of the two frequencies. If they are equal, the word is placed in the middle of the scale. However, if there is a imbalance in the uses, the word is drawn towards the more frequently related term. This process is repeated for thousands of other word combinations, creating a spectrum of word associations. Font size is based on a inverse power function (uniquely set for each visualization, so you can't compare across pieces). Vertical positioning is random.


Chris has created and shared a number of different versions on the Word Spectrum page of his website, and you can see high-resolutions PDFs of each there.

Want to try your own?  Building on Chris' idea, Jeff Clark from Neoformix has created interactive Word Spectrums using either Twitter or News as the source that lets you enter your own terms to compete.  I especially like the idea of pitting two competing brands against one another.


Wednesday
Dec162009

FREE Infographic Holiday Cards!


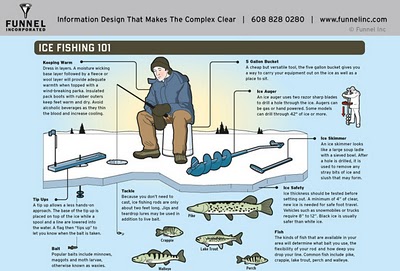
Once again this year, Funnel Inc. is offereing a free set of Holiday Infographic Cards to anyone who registers on their mailing list "while supplies last!"  You won't find the link on the main website, but here is the link for readers of Cool Infographics.


Also, there are four FREE Holiday desktop infographic images available on the same page at various resolutions.


Thanks to Lin at Funnel Inc. for keeping the link up for my readers!

Tuesday
Nov172009

Webpages As Graphs - Cool HTML visualizer applet


Marcel Salathe has created Webpages As Graphs, an interactive HTML DOM visualizer applet that will view any http:// website in a graphic form.  The image above is Cool Infographics, but the arrangement comes out a little different every time you run it.

Using Processing, Traer Physics and HTMLParser the site lets you enter the domain and then watch while it works its magic.  He has also made the source code available and instructions to print your graph as a poster.

HTML consists of so-called tags, like the A tag for links, IMG tag for images and so on. Since tags are nested in other tags, they are arranged in a hierarchical manner, and that hierarchy can be represented as a graph. I've written a little app that visualizes such a graph
I ran it for a number of other websites to see the differences, some were inspired by the examples on Marcel's site.

Amazon.com: Pretty complex site with lots of links, images and tables.


Apple.com: Simple design, as you expect from Apple.


Google.com:  Known for their clean front page.


LifeHacker.com:  Great blog with a very complex structure.


Friday
Oct302009

What's a Gruzzle?


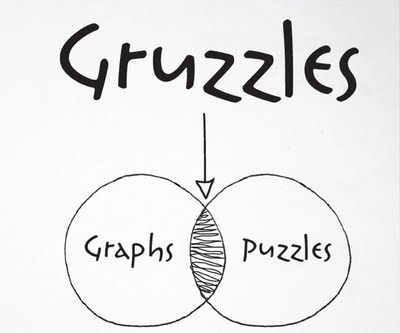
So, what's a Gruzzle?  With extensive use of Venn Diagrams, GL Hoffman often posts these visual blog posts on his blog, What Would Dad Say, and Fast Company has also started pubishing them as well.


So back to the original question, What's a Gruzzle?  Here's a really good answer, by one of his readers:


But here's the official answer:


You can also follow @GLHoffman on Twitter

Wednesday
Oct072009

CEO Compensation Infographic Contest Winner!


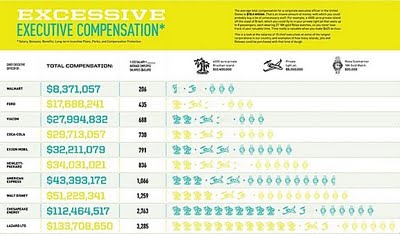
In September, GOOD magazine held an infographic contest to illustrate the top CEO compensation packages.  The above infographic by Dee Adams wins the prize!
Dee Adams’s piece “The Top 8 of CEO Compensation” does an excellent job of illustrating the massive salaries of CEOs and relating them to regular employees in a clean and simple manner. It’s our winner, and Adams will take home our prize package, including a GOOD T-shirt, a free subscription, and $250. You’ll be able to see her infographic in print in our next issue as well.
All of the entries are available for viewing here, but I wanted to include a few of my other favorites:


By Robin Richards:


By Jessica Karle:


Monday
Sep282009

Running The Numbers, New Book from Chris Jordan!


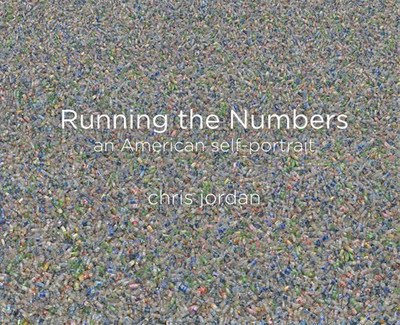
After finding the video last week, I also found that Chris Jordan has published a book of his work called "Running The Numbers".  I couldn't help myself, I had to buy a copy.  It's available on Amazon.com and directly from Chris Jordan's site.

Chris Jordan's photography is focused on visualizing the huge numbers and statistics from life in America.  His photos put the large quantities into a visual scale that our brains can understand.

Here's a link that will help support Cool Infographics too.

Friday
Sep252009

Infographic Stickers for your Walls


From Hu2 Design, cocktail recipe infographics for your wall (drink not included).  They've created different ones for Rum, Tequila, Whiskey, Gin and Vodka that show the drink recipes for the common mixed drinks.  They're also available in different colors to help coordinate with your wall colors, and the website lets you see the color graphics on different wall colors to find what you are looking for.
Hu2 Vinyl Stickers are designed to be applied to any smooth surface including walls, windows & furniture. The vinyl’s are completely removable and leave no residue.
Also available is a cocktail ingredients by percentage infographic.


They also have bath tub level indicators, cable organizers, and things not to be forgotten as you leave your house.  In addition to the infographic stickers, they offer a bunch of fun, decorative and well designed wall decals as well.  Go check them all out at Hu2.com

Thanks Romain!

EDIT: You can also follow Hu2Design on Twitter!


Thursday
Sep242009

Chris Jordan's TEDTalk 2008 - Visualizing Our World [video]

I've posted some of Chris Jordan's images here before, but here is a video of him talking about his work at TED in February 2008.

Artist Chris Jordan shows us an arresting view of what Western culture looks like. His supersized images picture some almost unimaginable statistics -- like the astonishing number of paper cups we use every single day.
Chris Jordan runs the numbers on modern American life -- making large-format, long-zoom artwork from the most mindblowing data about our stuff.
Thanks to Ben Fry for posting this on his site.

Here's a glimpse of Chris Jordan's current project in-progress on the island of Midway Atoll (http://www.midwayjourney.com/).

Thursday
Sep032009

reMap: An Amazing Visual Browsing Interface to VisualCompexity.com


Bestario has created reMap, an interactive portal to view all of the infographics posted on VisualComplexity.com, and it's amazing.  They've created semantic connection between the different infographics using tags tat allow for an incredible browsing experience.

An interactive, visual browsing interface to an infographic archive.

reMap displays visualcomplexity.com projects allowing navigation using a semantic approach and depicting relations among them. All images and texts belong to vc portal. Tags are assigned using a semantic engine created by Bestiario.
Thanks Jose!  I love it!

Saturday
Aug222009

Create Your Own Facebook Network Graph


Create a graph of your own network of friends on Facebook with Nexus.  You've seen many visuals of Twitter and Facebook connections, but this one is especially cool because it's your own network.  That's my network chart is above, but you don't care about mine...go create your own!

Found on Twitter