About
Randy Krum
President of InfoNewt.
Data Visualization and Infographic Design

Infographic Design

Infographics Design | Presentations
Consulting | Data Visualizations

DFW DataViz Meetup

Join the DFW Data Visualization and Infographics Meetup Group if you're in the Dallas/Fort Worth area!

Search the Cool Infographics site

Custom Search

Subscriptions:


Feedburner

The Cool Infographics® Gallery:

How to add the
Cool Infographics button to your:

Cool Infographics iOS icon

- iPhone
- iPad
- iPod Touch


Read on Flipboard for iPad and iPhone

Featured in the Tech & Science category

Flipboard icon

Twitter Feed
From the Bookstore

Caffeine Poster

The Caffeine Poster infographic

Entries in art (93)

Monday
Oct132008

Air Traffic Worldwide movie

Very similar to the Flight Patterns video I posted back in October 2007, this is a video showing all commercial flight in the world over a 24-hour period.  The previous video was only the U.S., but this one shows the entire world.  It also shows the day/night areas and you can see the increase in air traffic as dawn rises around the world.  Its from the Zhaw School of Engineering in Zurich.

Found via FlowingData.com

Thursday
Oct092008

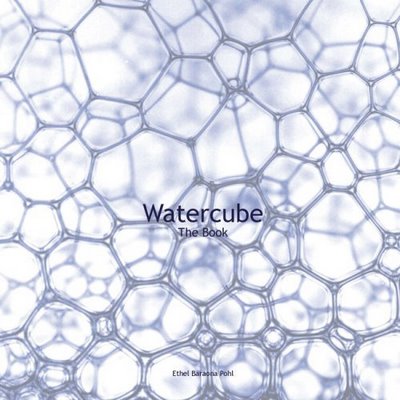
Watercube, The Book


Watercube, is a new book by Ethel Baraona Pohl.  The book is about the National Aquatics Centre built in Beijing for the 2008 Olympics, and has some cool infographics inside.  Some of the graphics were contributed by architect César Reyes Nájera.  A review of the book can be found here on www.v2com.biz
WATERCUBE: The Book is a complete monographic publication about the National Swimming Center for the Beijing Olympics 2008. With an exhaustive description about the Watercube we present a detailed study of the project. The book makes an holistic approach to the project that starts with a brief description of urban and social changes that China has been experienced in the last decade. These facts have encouraged the construction boom that made possible these kind of projects occur in cities like Beijing.

 
This page compared the amount of steel used to built the Watercube to some of the most well known buildings around the world.
This page shows a comparison to the same set of buildings around the world, but shows the tons of CO2 produced due to the steel used in their construction.


This page is one of the years of the timeline leading up to the construction of the Watercube.

Here you can buy Watercube, by Ethel Baraona Pohl, on Amazon.com.

Special thanks to Ethel for sharing the images from her book, and allowing me to post them on Cool Infographics!

Friday
Oct032008

The Age of Pop

From verysmallarray.com, the Age of Pop visualizes the #1 songs every week from 1960-1969.  You can see that Pop ruled the decade.  Check out their home page to see how other decades sounded.

Wednesday
Oct012008

The influence of Josef Müller-Brockmann Typography

Very cool infographic showing the the influence of Josef Müller-Brockmann.  By Quentin Delobel, it's on his site www.quentindelobel.com.
Josef Müller-Brockmann was a Swiss graphic designer and teacher, mostly recognised for his simple designs and his clean use of typography, notably Helvetica.  This visualization is the result of a personal web research about Josef Müller-Brockmann and the international typographical style. It contains 3 key elements: (1) the research of information on the web, (2) chronological information on Josef Muller-Brockmann's life and links to the last part, and finally the last part (3) is composed of a critical article based on information found online. The project is in french.
Thanks to Filipe for sending in the link!

Wednesday
Sep242008

Mashup DJ Girl Talk


From Wired.com, how do you visualize a music mashup of 300 different songs?
In the modern laptop era, any monkey with Pro Tools can make a mashup. But Pittsburgh-based computer maestro Girl Talk (known to the IRS as Gregg Gillis) has turned the cut-and-paste process into a jams-packed jigsaw puzzle. His latest album, Feed the Animals (released digitally in June with hard copies out September 23), brims with 300 song snippets in just over 50 minutes (compared to around 250 in his previous effort). "People want to see the bar raised," Gillis says. Below, a beat-by-beat breakdown of a single track.
Thanks Daniel for the link!

Friday
Aug292008

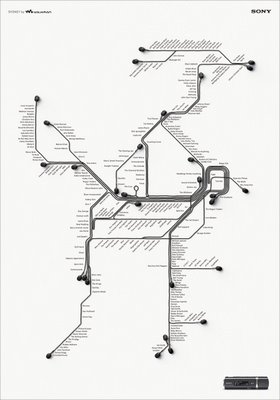
Sony Walkman advertising


This may cross the lines between infographics, advertising and art, but I really liked these advertising posters.  They're real subway maps of New York, London and Sydney, with a little artistic twist to add the ear buds.


I found these on Ad Goodness, and they were created by Saatchi & Saatchi.

Monday
Aug112008

Awesome Medical Visualizations

Really neat promotional video for Hybrid Medical Animation.  These guys do some amazing work.

Thursday
Jul312008

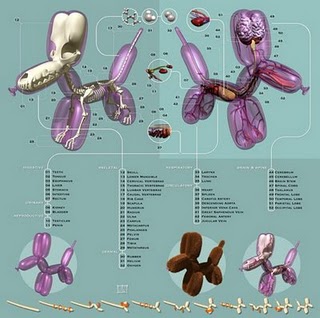
Anatomy of a Balloon Animal

Now here's an odd poster by Jason Freeny depicting the internal anatomy of balloon animals.  Check it out along with his other works at Moist Productions.  I especially liked that he included visual instructions on how to create the balloon animal at the bottom.

Thank Torquil for sending in the link!

Tuesday
Jul292008

Radiohead: House of Cards visualization video

Really cool use of visualization tools to create this music video for Radiohead's "House of Cards".

Check out this link to a different version on Google that lets you move the video image around while its playing. and the "making of" video that shows the laser scanners they used.

Radiohead just released a new video for its song "House of Cards" from the album "In Rainbows".

No cameras or lights were used. Instead two technologies were used to capture 3D images: Geometric Informatics and Velodyne LIDAR. Geometric Informatics scanning systems produce structured light to capture 3D images at close proximity, while a Velodyne Lidar system that uses multiple lasers is used to capture large environments such as landscapes. In this video, 64 lasers rotating and shooting in a 360 degree radius 900 times per minute produced all the exterior scenes.

Watch the making-of video to learn about how the video was made and the various technologies that were used to capture and render 3D data

Monday
Jul282008

Visualizing the Design Process: Michael DiTullo

Over on Think>Map>Draw, Michael DiTullo, the Design Director for Converse, shared his thoughts about design and sketched this parallel design process between the intended design process and the actual design process.

Sketch image: 2008 copyrighted Michael DiTullo and released under a Creative Commons Attribution-Noncommercial-No Derivative Works 3.0 Unported License.

Page 1 ... 3 4 5 6 7 ... 10 Next 10 Entries »