About
Randy Krum
President of InfoNewt.
Data Visualization and Infographic Design

Infographic Design

Infographics Design | Presentations
Consulting | Data Visualizations

DFW DataViz Meetup

Join the DFW Data Visualization and Infographics Meetup Group if you're in the Dallas/Fort Worth area!

Search the Cool Infographics site

Custom Search

Subscriptions:


Feedburner

The Cool Infographics® Gallery:

How to add the
Cool Infographics button to your:

Cool Infographics iOS icon

- iPhone
- iPad
- iPod Touch


Read on Flipboard for iPad and iPhone

Featured in the Tech & Science category

Flipboard icon

Twitter Feed
From the Bookstore

Caffeine Poster

The Caffeine Poster infographic

Entries in art (93)

Tuesday
Mar182008

New York Talk Exchange


Currently on exhibition at MOMA, The Museum of Modern Art, from Feb 24th - May 12th is an exhibit called "Design and Elastic Mind". New York Talk Exchange is included as part of the exhibition.

New York Talk Exchange illustrates the global exchange of information in real time by visualizing volumes of long distance telephone and IP (Internet Protocol) data flowing between New York and cities around the world.
Thanks Oliver!

Saturday
Mar152008

The Ebb and Flow of Movies

From nytimes.com. This is a very cool way to visualize the spike in movie ticket revenue when movies are released in theaters, and then slow down quickly after the first week. The graphic covers 1986-2007, and when you look back you can only find a few movies that maintained high ticket sales for more than a couple weeks. Star Wars Episode 1 and Titanic both had high sales for almost 6 weeks. Highlight and click any "wave" to see the details for that movie.

Summer blockbusters and holiday hits make up the bulk of box office revenue each year, while contenders for the top Oscar awards tend to attract smaller audiences that build over time. Here's a look at how movies have fared at the box office, after adjusting for inflation.
Thanks for sending in the link Dániel!

Wednesday
Mar122008

Ocean's Thirteen infographics


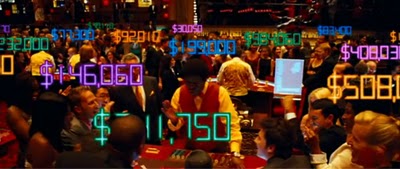
I can't upload the video (for obvious copyright reasons), but the movie Ocean's Thirteen uses some cool infographics to show the real-time winnings at each table in the casino.

Saturday
Mar082008

See the World in Words

I thought this was really cool!

Sunday
Mar022008

What if...


Craig Robinson, from flipflopflyin.com, has created a graphic showing many of the different paths/branches his life could have taken. Clicking on each character icon reveals text describing the event or deviation from actual events.

Who hasn't at one time or another wondered how their life could've gone in other directions if different events had occurred or different choices been made? These are the ways my life could've deviated from its actual path (the top row).
" Craig dies at the age of 34, killed by an angry swan" I found incredibly funny.

Found on NiXLOG.

Saturday
Mar012008

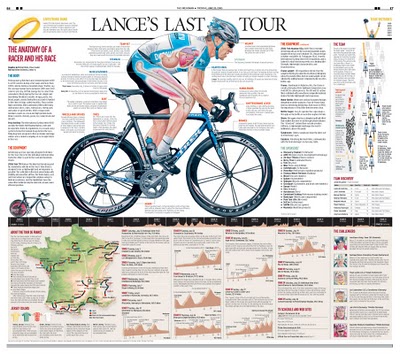
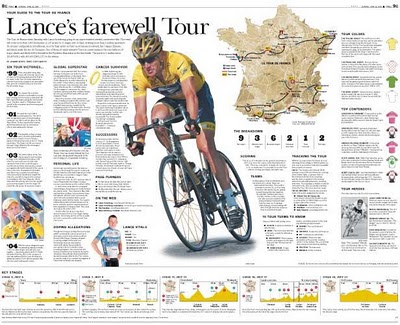
Lance's Last Tour


I found two good newspaper infographics from 2005 covering Lance Armstrong's last Tour de France on newsdesigner.com where you can get larger PDF files that make good posters. Both are two-page graphics (doubletrucks). The first is from The Oregonian (above), and the second is from the St. Pete Times (below).


Found on NiXLOG.

Thursday
Feb282008

Classifying Experiences


Stephen Anderson is an "experience architect" at Sabre Travel Network, and has created a poster to communicate how people Sort, Classify, and Label Experiences. Read Stephen's blog post explaining his efforts.

Found on NiXLOG.

Tuesday
Feb262008

Infographics for Advocacy


I got a note from John Emerson, the author of Visualizing Information for Advocacy, and I wanted to share that his booklet on using infographics for NGO's and advocacy organizations is now available online as a free PDF (6.9MB) at apperceptive.com. Although geared to advocacy groups, the information is definitely relevant to everyone.

John also has a blog post up on Social Design Notes.

Outstanding job John!

Tuesday
Feb192008

Meet The World, Infographic Flags


Meet The World is an infographic project that uses the colors of eight national flags to represent some of the current issues in the world.

Icaro Doria is Brazilian, 25 and has been working for the magazine Grande Reportagem, in Lisbon, Portugal, for the last 3 years. He is part of the team (with Luis Silva Dias, João Roque, Andrea Vallenti and João Roque) that produced the flags campaign which has been circulating the Earth in chain letters via e-mail.
I found the link to this on rc3.org.

Monday
Feb182008

GE Ecomagination Blueprint Ads

GE is running The Blueprint Series of five print ads combining photos with an overlay of infographics. This works really nicely because they kept the infographics relatively simple.

Found on notcot.com.

Page 1 ... 5 6 7 8 9 ... 10 Next 10 Entries »