About
Randy Krum
President of InfoNewt.
Data Visualization and Infographic Design

Infographic Design

Infographics Design | Presentations
Consulting | Data Visualizations

DFW DataViz Meetup

Join the DFW Data Visualization and Infographics Meetup Group if you're in the Dallas/Fort Worth area!

Search the Cool Infographics site

Custom Search

Subscriptions:


Feedburner

The Cool Infographics® Gallery:

How to add the
Cool Infographics button to your:

Cool Infographics iOS icon

- iPhone
- iPad
- iPod Touch


Read on Flipboard for iPad and iPhone

Featured in the Tech & Science category

Flipboard icon

Twitter Feed
From the Bookstore

Caffeine Poster

The Caffeine Poster infographic

Entries in design (479)

Thursday
Nov132008

Seasonal Visual Timelines


Roberto Rovira, and assistant professor of landscape architecture at the Florida International University's, School of Architecture, was kind enough to allow me to share some of his work with the readers of Cool Infographics.
 
Working as a consultant, these seasonal timelines were developed to show the activities and the plants used in a proposal for a project he led called "Envisioning Hudson Square" on the Hudson River near Manhattan, NY.
 
The first one shows the time of year that different activities would be active in this green area during the year like bicycling, bird watching and ice skating.  It also shows the different wildlife that would be present during the year like blue heron, striped bass and snowy egrets. Using the visual timeline you can see how the different activities overlap and that there would always be some type of activity during the year.
 
The second timeline from the same project show the proposed plant and trees to be used in the project, and with the use of the visual timeline shows their color and appearance throughout the year.
 
Graphics by Roberto Rovira, RLA, with assistance from landscape designer Kelly Woodward. Roberto is Assistant Professor in Landscape Architecture at Florida International University (www.fiu.edu/~soa) and Senior Landscape Architect consultant for ArquitectonicaGEO (www.arquitectonicageo.com), a Miami-based landscape and planning firm. He led GEO's design team and developed the concepts for 'Hudson Square Prints Green!', a proposal for a 30-block New York City district on Manhattan's West Side, adjacent to the Hudson River.

Wednesday
Oct292008

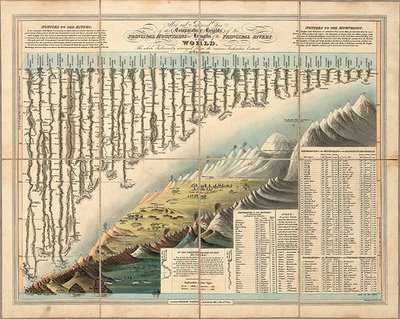
Classic infographic from 1823!


Here's a classic from 1823!  It a hand drawn infographic titled "Comparative Heights of the Principal Mountains and Lengths of the Principal Rivers of The World" by WR Gardner.  The high resolution image is on Flickr, but the post about the image is on bibliodyssey.blogspot.com.

This one makes a great poster!  Thanks Roi for sharing in the comments.

Monday
Oct202008

NEW Death and Taxes 2009 poster


New Death and Taxes infographic for 2009!  Interactive viewer let's you zoom in to see all of the details.
"Death and Taxes:2009" is a representational poster of the federal discretionary budget; the amount of money that is spent at the discretion of your elected representatives in Congress. Basically, your federal income taxes. The data is from the President's budget request for 2009. It will be debated, amended, and approved by Congress by October 1st to begin the fiscal year.

The poster provides a uniquely revealing look at our national priorities, that fluctuate yearly, according to the wishes of the President, the power of Congress, and the will of the people. If you pay taxes, then you have paid for a small part of everything in the poster. 
The Death and Taxes poster from 2007 was my initial post on Cool Infographics, so I'm very excited to see this update.  Now the 2009 version is available to purchase as a poster here.

Tuesday
Oct142008

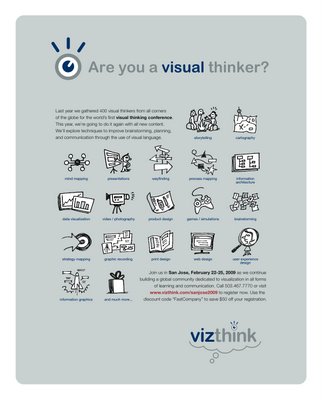
VizThink 2009


So VizThink Europe was this last weekend, and I came across this infographic ad in Fast Company magazine.  The next VizThink in the U.S. is coming up quickly.  February 22-25 in San Jose, CA.

Again, my friends at VizThink have created a discount code that I can offer to the readers of Cool Infographics!  Use the code BCRK01 to get $100 off of the standard registration price!

Special thanks to Ryan and the gang at VizThink!

$100 Off regular admission

DISCOUNT CODE: BCRK01

Thursday
Oct092008

Watercube, The Book


Watercube, is a new book by Ethel Baraona Pohl.  The book is about the National Aquatics Centre built in Beijing for the 2008 Olympics, and has some cool infographics inside.  Some of the graphics were contributed by architect César Reyes Nájera.  A review of the book can be found here on www.v2com.biz
WATERCUBE: The Book is a complete monographic publication about the National Swimming Center for the Beijing Olympics 2008. With an exhaustive description about the Watercube we present a detailed study of the project. The book makes an holistic approach to the project that starts with a brief description of urban and social changes that China has been experienced in the last decade. These facts have encouraged the construction boom that made possible these kind of projects occur in cities like Beijing.

 
This page compared the amount of steel used to built the Watercube to some of the most well known buildings around the world.
This page shows a comparison to the same set of buildings around the world, but shows the tons of CO2 produced due to the steel used in their construction.


This page is one of the years of the timeline leading up to the construction of the Watercube.

Here you can buy Watercube, by Ethel Baraona Pohl, on Amazon.com.

Special thanks to Ethel for sharing the images from her book, and allowing me to post them on Cool Infographics!

Tuesday
Oct072008

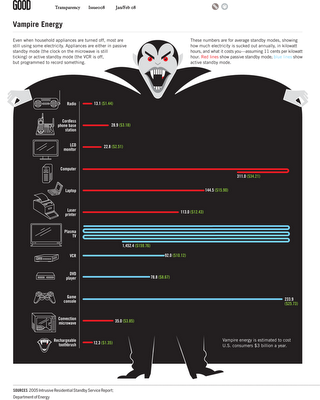
Vampire Energy infographic video & chart

From GOOD magazine, they created an infographic video about Vampire Energy, all of the energy used by electronics in your house while you are not actively using them.  The chart itself from the magazine is fairly simple chart, but I really like it.  It's effective getting the message across with simple graphics.

Wednesday
Oct012008

The influence of Josef Müller-Brockmann Typography

Very cool infographic showing the the influence of Josef Müller-Brockmann.  By Quentin Delobel, it's on his site www.quentindelobel.com.
Josef Müller-Brockmann was a Swiss graphic designer and teacher, mostly recognised for his simple designs and his clean use of typography, notably Helvetica.  This visualization is the result of a personal web research about Josef Müller-Brockmann and the international typographical style. It contains 3 key elements: (1) the research of information on the web, (2) chronological information on Josef Muller-Brockmann's life and links to the last part, and finally the last part (3) is composed of a critical article based on information found online. The project is in french.
Thanks to Filipe for sending in the link!

Saturday
Sep202008

Points Of View


This is a new t-shirt from Despair.com.  If you're not familiar with Despair, they are the opposite of Successories, the company that produces motivational posters.  I'm a big fan of their humor, and I loved the new shirt design.

Friday
Aug292008

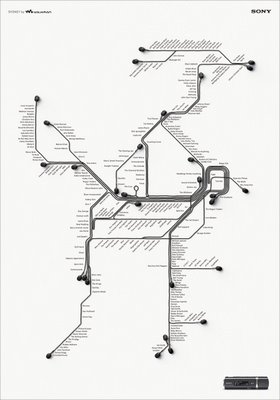
Sony Walkman advertising


This may cross the lines between infographics, advertising and art, but I really liked these advertising posters.  They're real subway maps of New York, London and Sydney, with a little artistic twist to add the ear buds.


I found these on Ad Goodness, and they were created by Saatchi & Saatchi.

Thursday
Aug282008

VizThink Europe Discount Code!


I know many of my readers would really enjoy the conference VizThink Europe, and the conference is coming up quickly.  The Europe version is in Berlin, Germany this year on October 12-14 at Crown Plaza Berlin City Centre.
We'll have lots of opportunities for hands on experiences, learning from industry gurus, and networking with your visual thinking peers. We'll be bringing a few of your favorite facilitators from San Francisco with all new content, plus a whole lot of new facilitators from Europe.
The great guys at VizThink have created a discount code for readers of Cool Infographics.  Use the code BCRK01 when you register to get €50 ($75-$80 in U.S. dollars these days) off any regular attendance fee (not student, Government or non-profit rates).

If you can get to Berlin (and I have a lot of readers from Europe), you would really get a lot from attending.

Big thanks to the guys at VizThink!