About
Randy Krum
President of InfoNewt.
Data Visualization and Infographic Design

Infographic Design

Infographics Design | Presentations
Consulting | Data Visualizations

DFW DataViz Meetup

Join the DFW Data Visualization and Infographics Meetup Group if you're in the Dallas/Fort Worth area!

Search the Cool Infographics site

Custom Search

Subscriptions:


Feedburner

The Cool Infographics® Gallery:

How to add the
Cool Infographics button to your:

Cool Infographics iOS icon

- iPhone
- iPad
- iPod Touch


Read on Flipboard for iPad and iPhone

Featured in the Tech & Science category

Flipboard icon

Twitter Feed
From the Bookstore

Caffeine Poster

The Caffeine Poster infographic

Entries in design (479)

Saturday
Aug232008

Olympic Wrap-Up


To complete the week of Olympic Infographics from the NYTimes.com, they have created a page to summarize all of the infographics they created.  They've been adding to it every day, so it won't actually be complete until the Olympics are over.

Sunday
Aug172008

Evolution of Olympic Torches


The group at the NY Times online has been working overtime to create a bunch of infographics as part of their coverage of the 2008 Olympics.  I'm going to highlight them this week with many of the graphics they've created.  Their graphics are coming our rapid-fire just like the events in China.

First up is an Olympic Torch History graphic, highlight the torch designs since 1936 for both the Summar and Winter Olympic Games.   Roll over each torch to see deatils behind the design.

Friday
Aug152008

National Debt and the Presidents

First, I'm not pushing any particular political agenda.  There's considerable debate around this chart, so I don't want to start any arguments.  The debate isn't around the validity of the data, but about how it's being presented.  The information is freely available from the U.S. Department of the Treasury and the Bureau of the Public Debt.

Second, I like that this chart takes a simple bar chart and adds a few more layers of information.  At its root, this is a timeline of the increase in the national debt based on the federal budget by year.  Then layered on top of that are the presidents in office that year, some color coding, the political party controlling the White House and highlights for record years.

Third, just to share the reasons for the debate.  This is a great example of data being visualized with a specific agenda in mind.  Obviously, this is a chart framed to make Republicans look bad, and Democrats look good.  The debate centers around a few issues like programs started by one President will carry into the term of another President and more importantly that the political party controlling Congress actually has more impact on the federal budget than the President does.

Friday
Aug082008

The Ropes at Disney


Found on CartoonBrew, this circular chart from 1943 shows the development process of an animated film through the different roles within the Disney organization.  Not exactly an org chart, this is more of a process map.

How do they make those drawings move?  This chart, an separate pull-out from the 1943 booklet, The Ropes At Disney’s (see below), explains the whole process.You’ll note that it all starts with “Walt”. And his main focus was “Story” and “Direction”.

Can you tell I’m going to Walt Disney World today?


Monday
Aug042008

The Art of Visual Thinking

Last week, Guy Kawasaki posted a good interview with Dan Roam on his blog.

Do you recognize this picture? It's how Southwest Airlines was pitched.

To provide more insight into the process of visual thinking, I tapped Dan Roam. He is the author of The Back of the Napkin: Solving Problems and Selling Ideas with Pictures . In this interview he explains why and how to use visual thinking in your business. Click here to read it. To learn even more about visual thinking, be sure to read his book.

Thursday
Jul312008

Anatomy of a Balloon Animal

Now here's an odd poster by Jason Freeny depicting the internal anatomy of balloon animals.  Check it out along with his other works at Moist Productions.  I especially liked that he included visual instructions on how to create the balloon animal at the bottom.

Thank Torquil for sending in the link!

Monday
Jul282008

Visualizing the Design Process: Michael DiTullo

Over on Think>Map>Draw, Michael DiTullo, the Design Director for Converse, shared his thoughts about design and sketched this parallel design process between the intended design process and the actual design process.

Sketch image: 2008 copyrighted Michael DiTullo and released under a Creative Commons Attribution-Noncommercial-No Derivative Works 3.0 Unported License.

Thursday
Jul242008

What Software do you use for Infographics?


A few readers have written emails to me asking about what software to use to create infographics.  My needs are pretty simple for my day job, so I only have a handful of tools that I use loaded onto my MacBook.  But the graphics I create are fairly simple, and don’t use massive amounts of data.

Yes, I included MS Office in the list because there are some really cool things you can do with Excel and PowerPoint.  I’ll post some examples in the future.


What software do you use?

Post about your favorite software in the comments and share your “must have” software with everyone here.

Wednesday
Jul232008

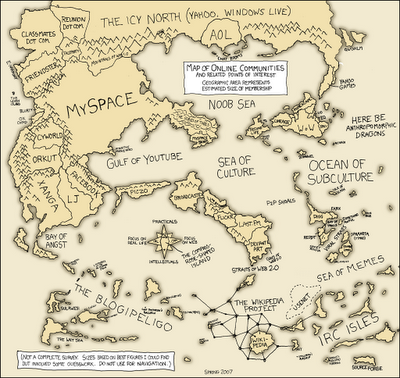
Map of Online Communities

Greetings from the Blogipeligo!

A fun infographic from xkcd.com that uses a map image to communicate the relative sizes of the different types of online communities.  I was impressed that I at least recognized most of them, and actually participate in some of them.

Wednesday
Jul162008

iPhone 3G under the hood

Will all of the hype around the launch of the iPhone 3G, I wanted to share a simple infographic showing the circuitboard from inside one of the new phones.  It clearly identifies each major component and also adds what that compnent does inside the phone.  The graphic really adds a significant amount of depth to the article.

The full article is from TechOnline.