About
Randy Krum
President of InfoNewt.
Data Visualization and Infographic Design

Infographic Design

Infographics Design | Presentations
Consulting | Data Visualizations

DFW DataViz Meetup

Join the DFW Data Visualization and Infographics Meetup Group if you're in the Dallas/Fort Worth area!

Search the Cool Infographics site

Custom Search

Subscriptions:


Feedburner

The Cool Infographics® Gallery:

How to add the
Cool Infographics button to your:

Cool Infographics iOS icon

- iPhone
- iPad
- iPod Touch


Read on Flipboard for iPad and iPhone

Featured in the Tech & Science category

Flipboard icon

Twitter Feed
From the Bookstore

Caffeine Poster

The Caffeine Poster infographic

Entries in health (118)

Monday
Jul262010

How Does Diet Soda Cause Weight Gain? [infographic video]

Another great use of infographics, illustrations and visual examples used in a video to better communicate a message.  How Does Diet Soda Cause Weight Gain? is a video from Wellness-Works.net.  I wish they would credit the artist so we knew who made the video for them.

An informative, fun video about the importance of your food’s pH and its impact on your health.

Wednesday
Apr072010

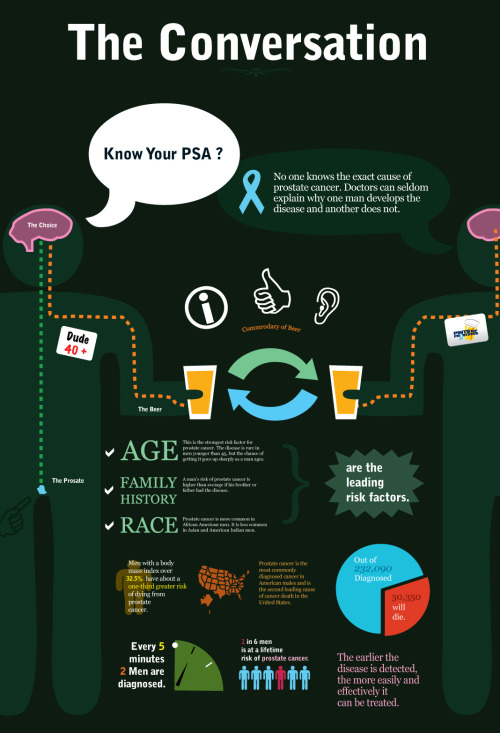
Prostate Cancer infographic

The Conversation” is an infographic about prostate cancer by designer Mike Wirth.  Mixing a few key statistics and visualization styles, I like that this infographic includes related illustrations, charts, relevant text explanations, the key numbers and a map.

Nice job Mike!

Thursday
Mar112010

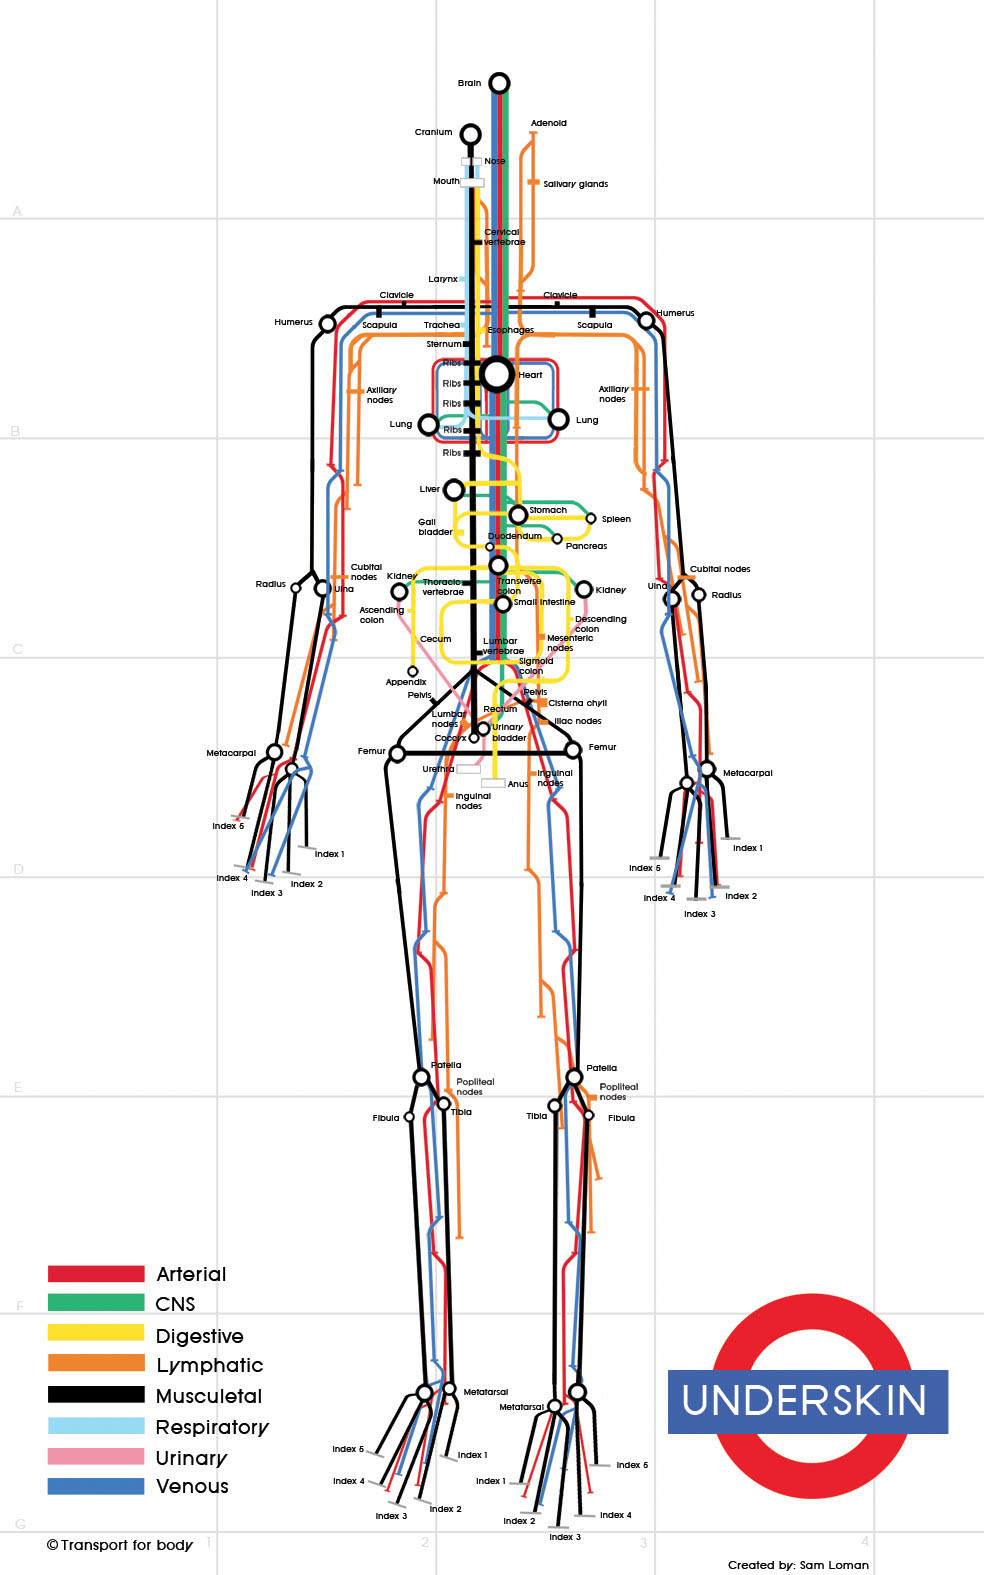
Underskin: The Human Subway Map

Sam Loman has taken the subway map infographic style to the human body.  Underskin is an infographic that traces the routes of eight different systems within the body (Digestive, Respiratory, Arterial, etc.), and highlights the major connection points.

You can see Sam’s work on just-sam.com, but the image there is low resolution.  She sent me the image above so you could see the high-resolution details.  Thanks Sam!

Found on VizWorld and Information Aesthetics.

Friday
Feb192010

Emily Schwartzman Wins Haiti Infographic Contest!

Emily Schwartzman has won the GOOD contest to design an infographic about the earthquake impact to Haiti.  A high-resolution version is available on the GOOD site.

We’re proud to announce the winner of our latest infographic contest, where we asked readers to design an infographic about the recent earthquake in Haiti. We at GOOD conferred with Aaron Perry-Zucker of Design for Haiti, and we’ve come to a decision.

Emily Schwartzman—whose graphic, “Aftermath of the Haiti Earthquake,” clearly and concisely depicts both the human toll of the earthquake and the scope of the earthquake itself—is our winner. Schwartzman will take home our prize package, including a GOOD T-shirt and a free subscription. You’ll be able to see her infographic in print in our next issue as well as on the Design for Haiti site.

Excellent job Emily!

Tuesday
Jan262010

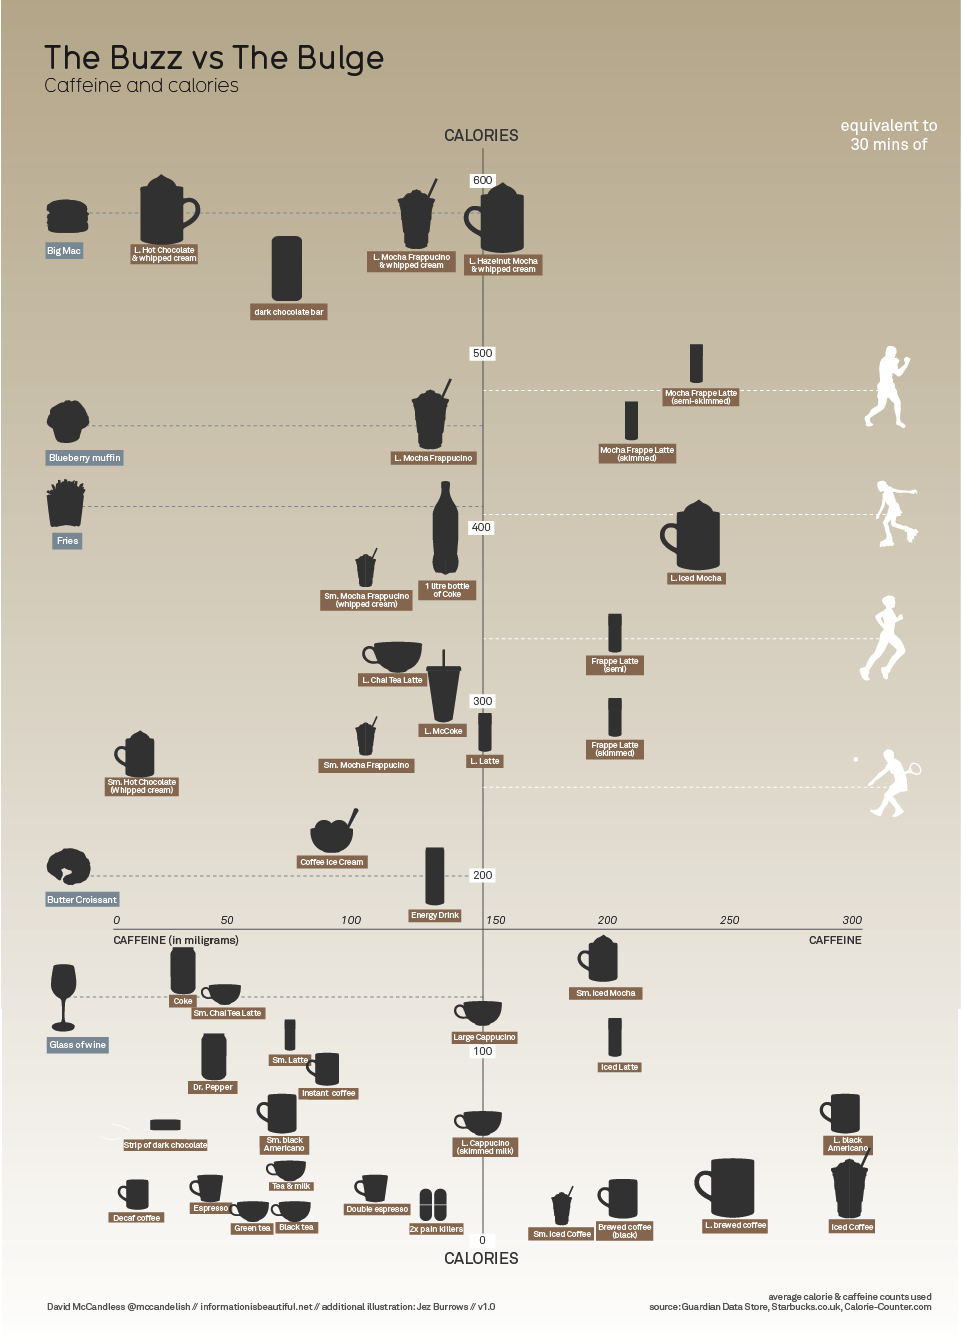
Caffeine and Calories

Check out another great caffeine infographic, The Buzz vs. The Bulge, by David McCandless from Information Is Beautiful.  Another great spin on caffeine in drinks, this one plots caffeine content on the X-Axis, and calories on Y-Axis.

I love that there are also some foods mixed in with the drinks like a dark chocolate car, a butter croissant and coffee ice cream (brilliant).

When I started working on my Caffeine Poster, this hadn’t come out yet.  One the reasons I choose caffeine as the data to visualize for my project was because there weren’t any good visuals to be found at that time.  I definitely wanted to acknowledge David’s great work.

Monday
Jan252010

Making-Of The Caffeine Poster - Part 3


How did you pick which drinks to include?

The original spreadsheet with the caffeine calculations had about 100 drinks on it, but that made the image WAY too crowded.  Looking back, I could have made the images smaller to fit more drinks onto the poster, so maybe the next version will have more.

For the coffee side, I picked some of the most widely available coffee shops, and I also only picked one drink from each.  Starbucks alone had 20-30 different drinks I could have listed.

For the drinks side, I picked the drinks that were most widely available at the grocery stores in the DFW area.  It may be different regionally, but the local region was all I had to work with.


Dude, where’s the TEA?!?

I posted this in the comments, but I know I left tea out of the graphic (along with thousands of other drinks). It was actually hard to cull down the wide assortment of drinks down to only the ones I included. Not a tea drinker myself, tea didn’t make the cut (Kevin Rose would be disappointed, I know).  It’s very crowded in the under 100mg space, so tea didn’t make the cut.  Based on the feedback I got, I’ll include it if a next versions happens.

FWIW, tea averages between 40-70mg of caffeine in each 8oz cup


Can I buy a copy of The Caffeine Poster?

I haven’t setup the poster for sale, but I did keep the high-resolution images offline so I could make it available if there was interest.  The images on Flickr are certainly high-resolution enough to read the details, but they won’t print very nicely as a 24” x 36” poster.  So far, I haven’t heard from many people who wanted to buy a copy.

I also got some feedback that The Caffeine Poster makes a good infographic, but maybe not a great poster.  To be a great poster, it probably need more details and other additional information to make the viewer curious to step closer and read more.

However, I did have a few copies printed for myself…of course.


Will there be a next version?

Probably.  I’ve got some other projects in the works, so there’s no telling how long it will take.  You suggestions on what to change or add are very welcome.


The is the end of the Making-Of posts.  I got so many questions about the behind-the-scenes stuff that I moved all of The Caffeine Poster posts together on a separate page.  Check out the Caffeine Poster link at the top of the page.

Wednesday
Jan202010

Making-Of The Caffeine Poster - Part 2

This is Part 2 in the continuing the series to share the details behind creating The Caffeine Poster.  I am going to create one web page to combine all of these Making-Of notes together, and I’ll post a link to that in Part 3.

Where did the data come from?

There was no one, single complete source for the data.  A number of the company websites have their caffeine content listed in the Nutrition Facts of product information, so if it was available I used their own information.
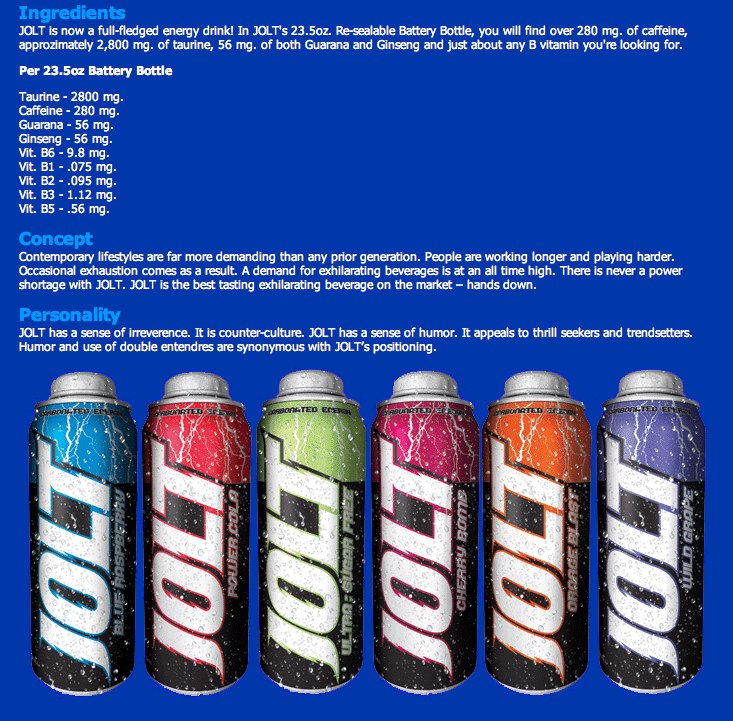
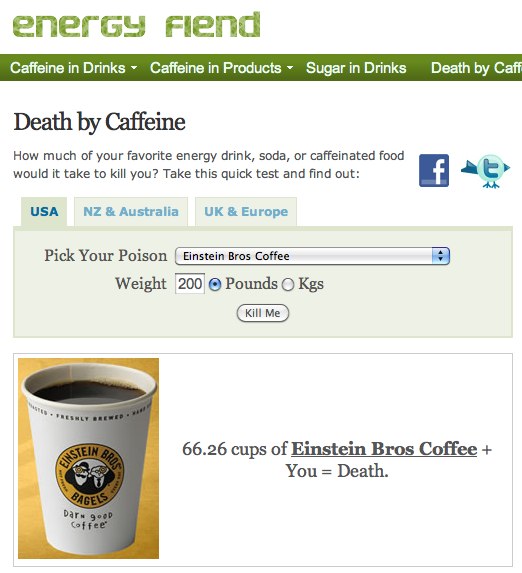
EnergyFiend.com has the largest database I found of caffeine contents in drinks and foods.  If I found different values for the caffeine content on different websites, I would just use an average.
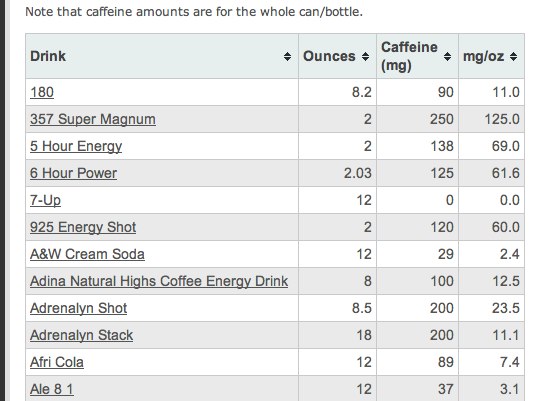


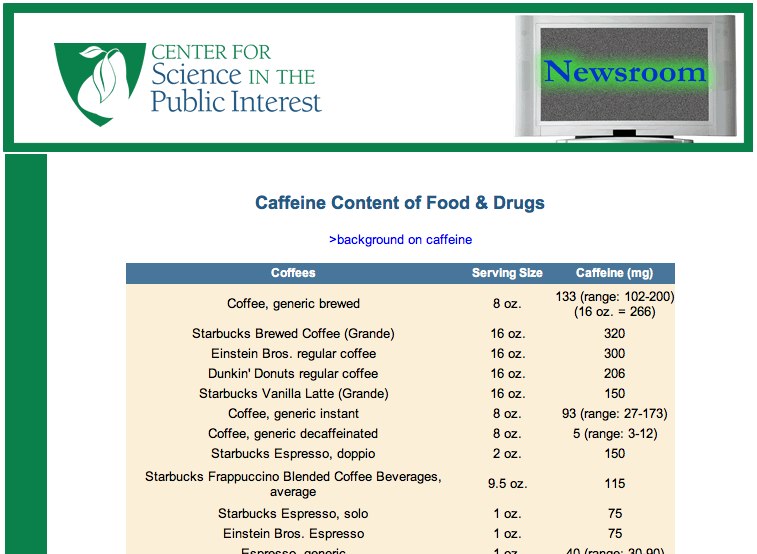
The Center for Science in the Public Interest also has the caffeine content listed for many drinks.
 

As a side note, EnergyFiend also has this great Death By Caffeine calculator!
 

The drinks come is many different sizes.  Why didn’t you standardize the drinks sizes?

This was probably the feedback I’ve heard most often since posting the infographic.  I posted a short answer in the comments, but here I can provide some additional explanation.

First, the data itself isn;t that complicated.  I didn’t need to use any statistical software to massage the numbers.  A simple spreadsheet in Numbers takes care of all the number crunching.
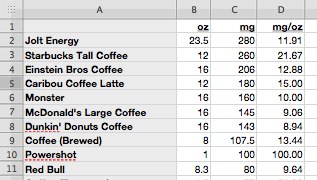
Even in this small piece of the spreadsheet, you can see a number of different drink sizes.  My choice was to either visualize column C or D.  The mg column represents the amount of caffeine you will consume from the entire drink.  The mg/oz column represents the amount of caffeine in each oz of liquid.

From a scientific point-of-view, the mg/oz is a common denominator and is probably a true apples-to-apples comparison.  This option would have shown the strength of the caffeine concentration in each formula, and you could see how much stronger the Starbucks coffee is compared to Dunkin’ Donuts.

However, my target market for the infographic isn’t the scientist that formulates the drinks, but the consumers that drink them.  Most of these drinks aren’t available in self-serve dispensers, so the consumer will drink whatever quantity they purchase (10oz, 12oz, 16oz, etc.).  By visualizing the total caffeine content of each drink, the consumer knows instantly how much caffeine they are putting into their body when they consume a drink.

For people that want to know the concentration, maybe I’ll add that as a side note for each drink in the next version.  :)


The caffeine content can differ each time you brew coffee, how did you choose only one number for each drink?

Even though caffeine content may vary from one drink to the next, all of the company sites and other websites list one average number for each drink.  Because the visual is a scale, the overall intent is to visualize the drinks in comparison to each other.  Precision wasn’t as important as showing them as higher or lower caffeine content relative to each other.

To be more exact, I could have listed ranges, and that wouldn’t have changed the drink locations on the scale.  BUT, ranges also weren’t available from the data sources, so it really wasn’t an option and I didn’t worry about it too much.
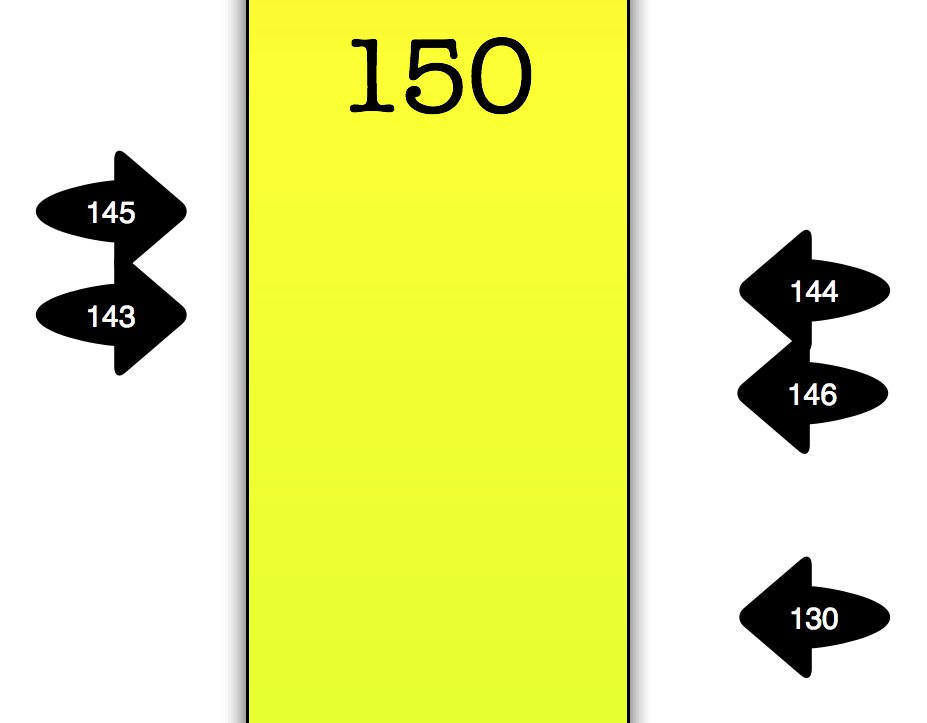
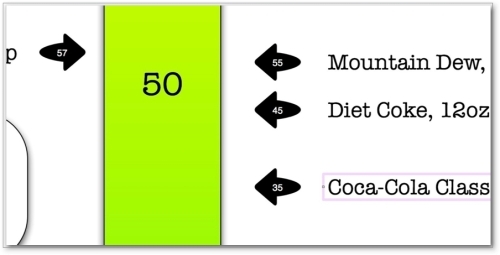
Adding the caffeine content numbers in the indicator arrows was actually a last-minute change.  Originally, I had intended not to list a specific number, because the values can vary.  Without the numbers, it leaves the actual content a little vague.

I also had some friends and designers look at an early version to get some feedback, and they would ask what the numbers were.  In the end, I decided that I personally would want to see the values if I were seeing the poster for the first time, so I added them.

Good thing I did too!  I found two drinks that were reversed and in the wrong place, so adding the numbers was a great way to check the accuracy of the design.


What is this thing?
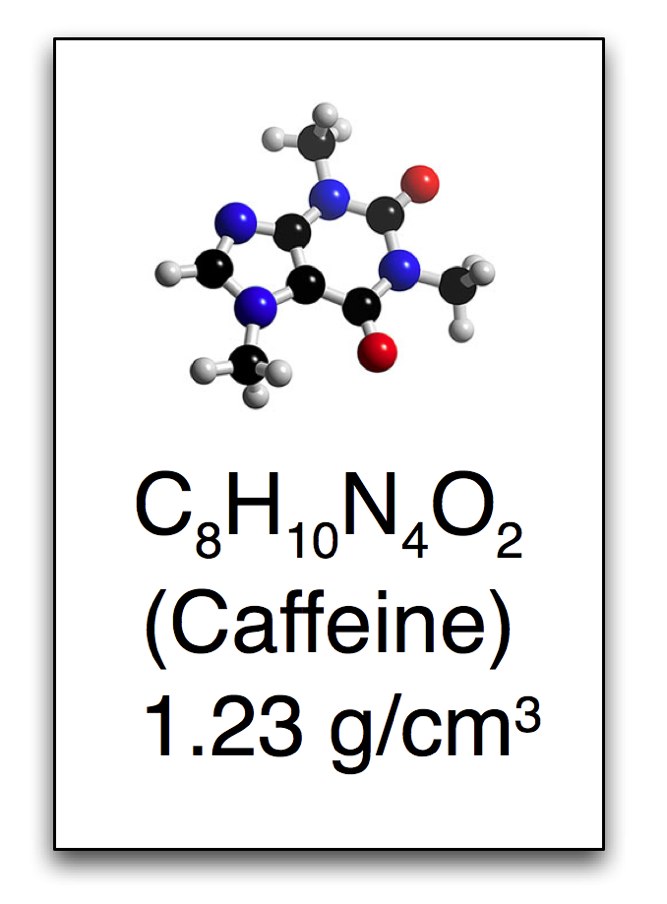
 

To emphasize the science behind caffeine, I included this rectangle that looks like it comes from the periodic table of elements.  Caffeine isn’t an element, so I could only use the style of the periodic table with this 3-D rendering of a caffeine molecule, the chemical formula of caffeine and the molecular weight.


More to come in Part 3…

Monday
Jan112010

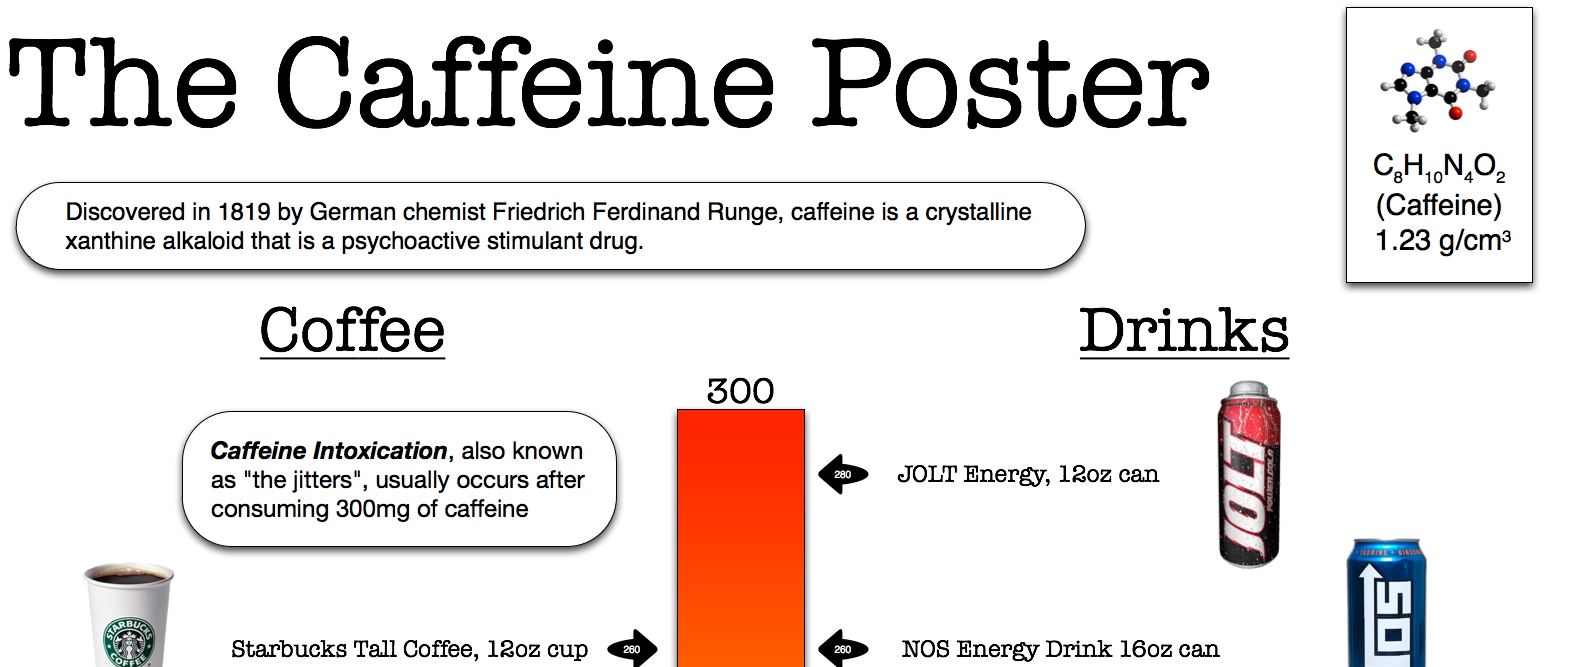
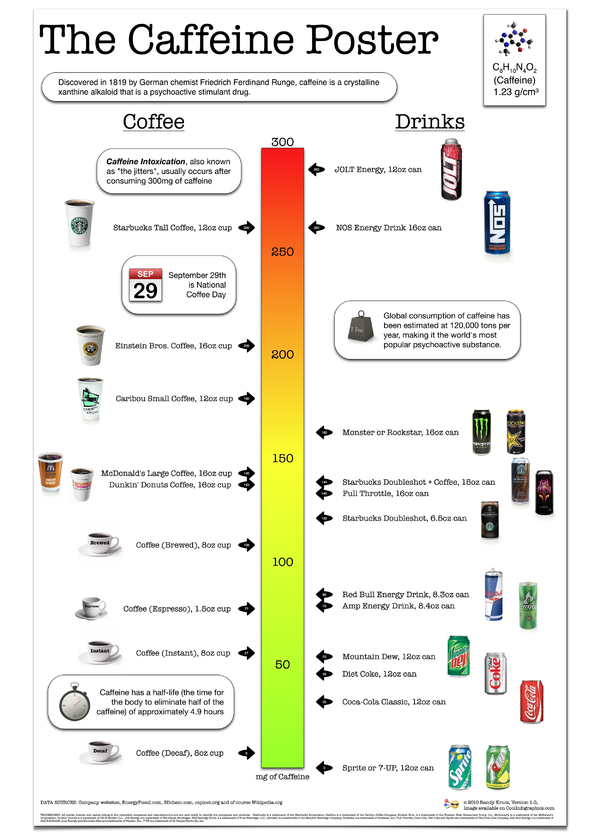
The Caffeine Poster, How Much Caffeine Are You Drinking? [new infographic]


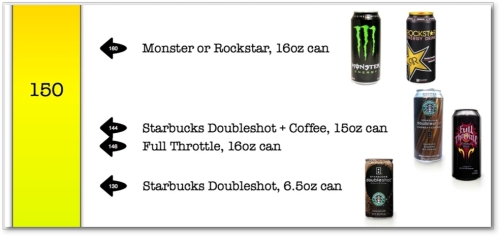
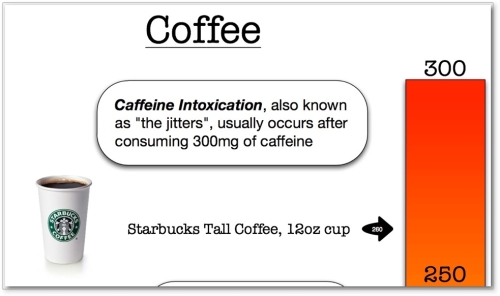
You are what you drink.  With so many drinks today claiming to be “energy drinks”, I wanted a little visual clarification, so I made The Caffeine Poster.  With coffee drinks on one side and canned cold drinks on the other, you can quickly see how much of a caffeine “hit” (in mg) you will get after consuming.  What’s especially interesting is many of the drinks have a very high caffeine mg/oz ratio, but the drink is so small you don’t get that much total caffeine.


I’ve been working on my own infographic for 6 months now off-and-on when I can make time.  I figured that I’ve been running this infographic blog for a few years now, it’s time to start putting up my own work.  Most of the data visualization I’ve designed are confidential to the company I make them for, so I wanted to create some infographics that I can publish on the blog.


The Caffeine Poster is supposed to help with one decision in your life.  If you’re going to grab a caffeine drink during the day (or evening), which drink should you consume?  I tried to stay focused on telling one story really well.  I’ve heard from others that this may make for a really good infographic, but may not make a great poster because a good poster would have a much deeper level of detail.  I like it, and we’ll see what king of responses I get.


I absolutely want to hear your feedback.  Please add your comments below or send me a note.  What do you think?  I’ve also got requests to print and offer this as a poster.  We’ll see if there is enough interest…

Also, I’m planning to post as “Making-of” article on what it took to create this infographic.


Making-Of The Caffeine Poster - Part 1

Making-Of The Caffeine Poster - Part 2

Making-Of The Caffeine Poster - Part 3


THANKS: A big thanks to Fast Company for posting about The Caffeine Poster on the Fast Company blog.  The Caffeine Poster was the most popular story of the week on Fast Company! 


You are what you drink!

Wednesday
Dec092009

The Origins and Paths of Epidemics


This world map shows the origins and spreading paths of Malaria, Leprosy and Small Pox. No legend, but the implication is that as the main arteries diminish in width down to small capillaries represents the number of infection cases.  Key dates and locations are also identified with event description.

There is no designer byline on the graphic, but map is credited to Haisam Hussein.  I don't see the map in the gallery on Haisam's website, but he is given credit for the map on Lapham's Quarterly.

Found on digg.com.

Wednesday
Nov252009

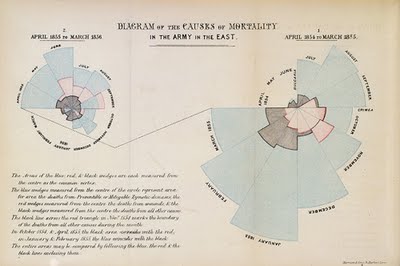
Florence Nightingale: Causes of Mortality infographic from 1858!


Yes, from that Florence Nightingale (1820-1910), and it's from 1858!  The polar area diagram is also known as the Nightingale Rose Graph.

From Wikipedia,
This "Diagram of the causes of mortality in the army in the East" was published in Notes on Matters Affecting the Health, Efficiency, and Hospital Administration of the British Army and sent to Queen Victoria in 1858.


This graphic indicates the number of deaths that occured from preventable diseases (in blue), those that were the results of wounds (in red), and those due to other causes (in black). 
The legend reads: 
The Areas of the blue, red, & black wedges are each measured from the centre as the common vertex. The blue wedges measured from the centre of the circle represent area for area the deaths from Preventable or Mitigable Zymotic diseases, the red wedges measured from the centre the deaths from wounds, & the black wedges measured from the centre the deaths from all other causes. The black line across the red triangle in Nov. 1854 marks the boundary of the deaths from all other causes during the month. In October 1854, & April 1855, the black area coincides with the red, in January & February 1855,(*) the blue coincides with the black. The entire areas may be compared by following the blue, the red, & the black lines enclosing them.
Also from Wikipedia:
Florence Nightingale had exhibited a gift for mathematics from an early age and excelled in the subject under the tutorship of her father. Later, Nightingale became a pioneer in the visual presentation of information and statistical graphics. Among other things she used the pie chart, which had first been developed by William Playfair in 1801.
Florence Nightingale is credited with developing a form of the pie chart now known as the polar area diagram, or occasionally the Nightingale rose diagram, equivalent to a modern circular histogram to illustrate seasonal sources of patient mortality in the military field hospital she managed. Nightingale called a compilation of such diagrams a "coxcomb", but later that term has frequently been used for the individual diagrams. She made extensive use of coxcombs to present reports on the nature and magnitude of the conditions of medical care in the Crimean War to Members of Parliament and civil servants who would have been unlikely to read or understand traditional statistical reports.
In her later life Nightingale made a comprehensive statistical study of sanitation in Indian rural life and was the leading figure in the introduction of improved medical care and public health service in India.
In 1859 Nightingale was elected the first female member of the Royal Statistical Society and she later became an honorary member of the American Statistical Association.
Found this while reading the great FlowingData post "9 Ways to Visualize Proportions – A Guide" by Nathan Yau.

KXVTA2R4XWE3
FRJK52DWMBJQ

Page 1 ... 6 7 8 9 10 ... 12 Next 10 Entries »