About
Randy Krum
President of InfoNewt.
Data Visualization and Infographic Design

Infographic Design

Infographics Design | Presentations
Consulting | Data Visualizations

DFW DataViz Meetup

Join the DFW Data Visualization and Infographics Meetup Group if you're in the Dallas/Fort Worth area!

Search the Cool Infographics site

Custom Search

Subscriptions:


Feedburner

The Cool Infographics® Gallery:

How to add the
Cool Infographics button to your:

Cool Infographics iOS icon

- iPhone
- iPad
- iPod Touch


Read on Flipboard for iPad and iPhone

Featured in the Tech & Science category

Flipboard icon

Twitter Feed
From the Bookstore

Caffeine Poster

The Caffeine Poster infographic

Entries in history (262)

Wednesday
Oct222008

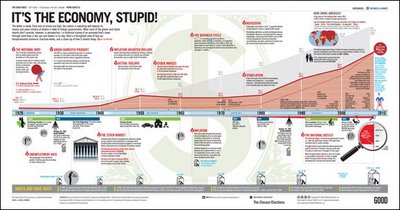
It's the Economy, Stupid!


Great timeline from GOOD Magazine (via picdit.com).
What most of the doom-and-gloom reports on our economy don’t provide is perspective—a historical survey of an economy that’s been through more than a few ups and downs in its day. Here’s a farsighted view of how our temperamental economic machine works, and a close-up of how it stands today.
Thanks Adam!

Friday
Oct102008

Savings Mis-Trust video

Our friends over at XPLANE have done a fabulous video explaining what led up to the recent credit crisis in the U.S. economy.  A great job simplifying a complex problem.

Thanks Parker, and great job to your team!

Thursday
Oct092008

Watercube, The Book


Watercube, is a new book by Ethel Baraona Pohl.  The book is about the National Aquatics Centre built in Beijing for the 2008 Olympics, and has some cool infographics inside.  Some of the graphics were contributed by architect César Reyes Nájera.  A review of the book can be found here on www.v2com.biz
WATERCUBE: The Book is a complete monographic publication about the National Swimming Center for the Beijing Olympics 2008. With an exhaustive description about the Watercube we present a detailed study of the project. The book makes an holistic approach to the project that starts with a brief description of urban and social changes that China has been experienced in the last decade. These facts have encouraged the construction boom that made possible these kind of projects occur in cities like Beijing.

 
This page compared the amount of steel used to built the Watercube to some of the most well known buildings around the world.
This page shows a comparison to the same set of buildings around the world, but shows the tons of CO2 produced due to the steel used in their construction.


This page is one of the years of the timeline leading up to the construction of the Watercube.

Here you can buy Watercube, by Ethel Baraona Pohl, on Amazon.com.

Special thanks to Ethel for sharing the images from her book, and allowing me to post them on Cool Infographics!

Friday
Oct032008

The Age of Pop

From verysmallarray.com, the Age of Pop visualizes the #1 songs every week from 1960-1969.  You can see that Pop ruled the decade.  Check out their home page to see how other decades sounded.

Monday
Sep222008

Probabilistic Stock Market Forecast


I won't claim to understand or attempt to explain the math behind the investolution.com charts that predict the overall stock market for the next 40 days.
This page contains the prediction for S&P 500 Index minimum and maximum daily closing prices over the next 40 trading days.  

It is predicted that S&P 500 Index will not close under 1,178 and over 1,295 between the dates September 19, 2008 and November 14, 2008. This prediction method was accurate for 71.0% and 95.0% of the cases (for minimum and maximum predictions, respectively) within an error margin of +-5% in the past. 

Thanks Andrew for sending in the link.

Saturday
Aug232008

Olympic Wrap-Up


To complete the week of Olympic Infographics from the NYTimes.com, they have created a page to summarize all of the infographics they created.  They've been adding to it every day, so it won't actually be complete until the Olympics are over.

Friday
Aug222008

Beijing Air Quality Index


NYTimes.com is also tracking the Air Quality Index by day during the Olympics using a heatmap style graphic.  There's definitely more pollution and particles in the air than most of the participants are used to.  So far, there have been a couple of days in the 90's, but didn't cross over 100 into the "unhealthy" range.

Thursday
Aug212008

Olympic Maps of Beijing


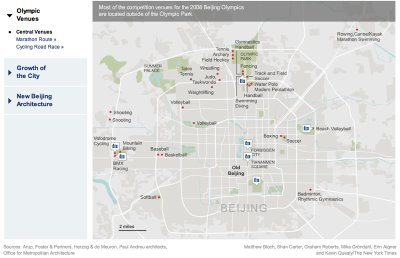
Let's not forget the Maps!  NYTimes.com has a number of interactive maps of the Beijing area showing the event locations, new architecture built for the Olympics, the demolition and expansion of the old city over the last 10 years, the new subway routes and some of the routes for the marathon and cycling events.

Wednesday
Aug202008

Olympics Schedule Tracker


The Olympics Tracker is an interactive schedule of the events.  It now only shows which events are scheduled each day and hour, but you can drag them to rearrange your favorites to the top.  Clicking on past events shows the results, and clicking on future events shows the upcoming event details.  Medal awarding events marked with a small medal icon.  You can even download a desktop version for Mac or Windows.

Tuesday
Aug192008

Olympic History of World Records


The History of World Records from NYTimes.com shows how the world record in a number of Summer Olympic events has progressively been beaten over the last 100 years.  In this chart, the Men's 100m Freestyle record was beaten three times this year improving the world record by 0.45 seconds.  Similar events are all charted together, so you can see other freestyle events on the same chart.