About
Randy Krum
President of InfoNewt.
Data Visualization and Infographic Design

Infographic Design

Infographics Design | Presentations
Consulting | Data Visualizations

DFW DataViz Meetup

Join the DFW Data Visualization and Infographics Meetup Group if you're in the Dallas/Fort Worth area!

Search the Cool Infographics site

Custom Search

Subscriptions:


Feedburner

The Cool Infographics® Gallery:

How to add the
Cool Infographics button to your:

Cool Infographics iOS icon

- iPhone
- iPad
- iPod Touch


Read on Flipboard for iPad and iPhone

Featured in the Tech & Science category

Flipboard icon

Twitter Feed
From the Bookstore

Caffeine Poster

The Caffeine Poster infographic

Entries in history (262)

Monday
Aug182008

Olympics Medal Count Map


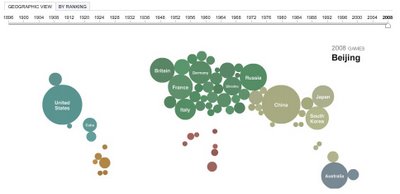
The Medal Count Map from the NYTimes.com show the total number of medals each country has won in every olympics since 1896.  Choose a year on the timeline to animate the graphic.  Rolling your mouse over a country will show the breakdown of Gold, Silver and Bronze medals and clicking will bring up a complete list of the events and medal winners.

Sunday
Aug172008

Evolution of Olympic Torches


The group at the NY Times online has been working overtime to create a bunch of infographics as part of their coverage of the 2008 Olympics.  I'm going to highlight them this week with many of the graphics they've created.  Their graphics are coming our rapid-fire just like the events in China.

First up is an Olympic Torch History graphic, highlight the torch designs since 1936 for both the Summar and Winter Olympic Games.   Roll over each torch to see deatils behind the design.

Friday
Aug152008

National Debt and the Presidents

First, I'm not pushing any particular political agenda.  There's considerable debate around this chart, so I don't want to start any arguments.  The debate isn't around the validity of the data, but about how it's being presented.  The information is freely available from the U.S. Department of the Treasury and the Bureau of the Public Debt.

Second, I like that this chart takes a simple bar chart and adds a few more layers of information.  At its root, this is a timeline of the increase in the national debt based on the federal budget by year.  Then layered on top of that are the presidents in office that year, some color coding, the political party controlling the White House and highlights for record years.

Third, just to share the reasons for the debate.  This is a great example of data being visualized with a specific agenda in mind.  Obviously, this is a chart framed to make Republicans look bad, and Democrats look good.  The debate centers around a few issues like programs started by one President will carry into the term of another President and more importantly that the political party controlling Congress actually has more impact on the federal budget than the President does.

Wednesday
Aug062008

Visual Baby Name Trends site

NameTrends.net is a fantastic interactive site that charts and maps the popularity of baby names over the last century in the U.S.  You can look at the most popular names, or search for specific names to see their results.  The chart above shows the top 20 baby names from the 2000's decade (10 boys and 10 girls).  You can see that those names also had some popularity at the end of the 19th century.

The site also allows you to map the name popularity by state.  The slider across the top allows you to see the geographic distribution by year.

Found on Information Aesthetics.

Monday
Jul072008

The iPhone Timeline

From iPhoneGold.org, is a cool little iPhone timeline.  I couldn't find an author to credit, just the website.

Found on digg.com

Friday
Jun202008

Gerd Arntz


Gerd Arntz (1900-1988) was a German artist with a political activist focus. Many of his infographics, as well as his Isotype project to create a universal set of icons for signs, are available at www.gerdarntz.org. This infographic poster shows the New York City population explosion from 25,000 in 1767 to 9.5 million in 1930.

Tuesday
Jun172008

Code Swarm: Eclipse


code_swarm - Eclipse (short ver.) from Michael Ogawa on Vimeo.

Created by Michael Ogawa. Check out the website describing the project here.

This visualization, called code_swarm, shows the history of commits in a software project. A commit happens when a developer makes changes to the code or documents and transfers them into the central project repository. Both developers and files are represented as moving elements. When a developer commits a file, it lights up and flies towards that developer. Files are colored according to their purpose, such as whether they are source code or a document. If files or developers have not been active for a while, they will fade away. A histogram at the bottom keeps a reminder of what has come before.
Thanks Alwyn for sending in the link!

Friday
Jun132008

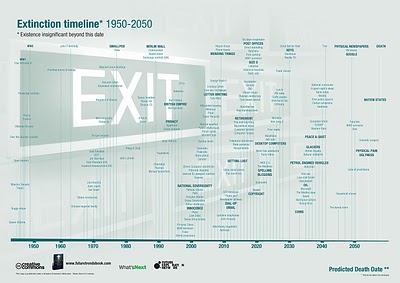
The Extinction Timeline 1950-2050


Richard Dawson from What's Next (www.nowandnext.com) created the Extinction Timeline with his predictions of what products and services will disappear in the next 50 years. Also available as a PDF here. Here are a few highlights:

  • 2018 DVDs
  • 2019 Libraries
  • 2025 Desktop computers
  • 2030 Reality TV (why so long?!?)
  • 2037 Glaciers
  • 2049 Physical Newspapers
Found on Digg.com

Monday
May192008

LifeMap

Ritwik Dey charted out his life from age 6 to 24 as an infographic timeline project, and shared it on Flickr.

I just discovered Visual Think Map, which is where I found a link to the LifeMap. I added it to my blogroll on the right.

Thursday
Apr172008

The Growth of Wal*Mart


Great video found on blog.kiwitobes.com that show the store expansion of Wal*Mart starting with the first store in 1962. Based on the publicly available data on freebase.com.