About
Randy Krum
President of InfoNewt.
Data Visualization and Infographic Design

Infographic Design

Infographics Design | Presentations
Consulting | Data Visualizations

DFW DataViz Meetup

Join the DFW Data Visualization and Infographics Meetup Group if you're in the Dallas/Fort Worth area!

Search the Cool Infographics site

Custom Search

Subscriptions:


Feedburner

The Cool Infographics® Gallery:

How to add the
Cool Infographics button to your:

Cool Infographics iOS icon

- iPhone
- iPad
- iPod Touch


Read on Flipboard for iPad and iPhone

Featured in the Tech & Science category

Flipboard icon

Twitter Feed
From the Bookstore

Caffeine Poster

The Caffeine Poster infographic

Entries in politics (59)

Wednesday
Oct222008

It's the Economy, Stupid!


Great timeline from GOOD Magazine (via picdit.com).
What most of the doom-and-gloom reports on our economy don’t provide is perspective—a historical survey of an economy that’s been through more than a few ups and downs in its day. Here’s a farsighted view of how our temperamental economic machine works, and a close-up of how it stands today.
Thanks Adam!

Monday
Oct202008

NEW Death and Taxes 2009 poster


New Death and Taxes infographic for 2009!  Interactive viewer let's you zoom in to see all of the details.
"Death and Taxes:2009" is a representational poster of the federal discretionary budget; the amount of money that is spent at the discretion of your elected representatives in Congress. Basically, your federal income taxes. The data is from the President's budget request for 2009. It will be debated, amended, and approved by Congress by October 1st to begin the fiscal year.

The poster provides a uniquely revealing look at our national priorities, that fluctuate yearly, according to the wishes of the President, the power of Congress, and the will of the people. If you pay taxes, then you have paid for a small part of everything in the poster. 
The Death and Taxes poster from 2007 was my initial post on Cool Infographics, so I'm very excited to see this update.  Now the 2009 version is available to purchase as a poster here.

Friday
Aug152008

National Debt and the Presidents

First, I'm not pushing any particular political agenda.  There's considerable debate around this chart, so I don't want to start any arguments.  The debate isn't around the validity of the data, but about how it's being presented.  The information is freely available from the U.S. Department of the Treasury and the Bureau of the Public Debt.

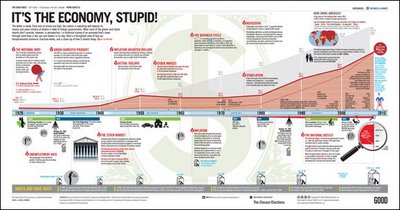
Second, I like that this chart takes a simple bar chart and adds a few more layers of information.  At its root, this is a timeline of the increase in the national debt based on the federal budget by year.  Then layered on top of that are the presidents in office that year, some color coding, the political party controlling the White House and highlights for record years.

Third, just to share the reasons for the debate.  This is a great example of data being visualized with a specific agenda in mind.  Obviously, this is a chart framed to make Republicans look bad, and Democrats look good.  The debate centers around a few issues like programs started by one President will carry into the term of another President and more importantly that the political party controlling Congress actually has more impact on the federal budget than the President does.

Friday
Jul042008

U.S. Flag Infographic

For the 4th of July, I wanted to post a new link to the U.S. flag as an infographic, but it looks like the "Meet The World" brazilian website that I posted about in February 2008 is down right now.  I still have the image, and its from the flag series by artist Icaro Doria. 

Icaro Doria is Brazilian, 25 and has been working for the magazine Grande Reportagem, in Lisbon, Portugal, for the last 3 years. He is part of the team (with Luis Silva Dias, João Roque, Andrea Vallenti and João Roque) that produced the flags campaign which has been circulating the Earth in chain letters via e-mail.

Monday
Jun232008

Obama Funding Graphic


A small poster from our friends at XPLANE,

How Obama Reinvented Campaign Finance Barack Obama is the first major candidate to decline participation in the public financing system for presidential campaigns. He’s found a more effective way to raise money — by leveraging the power of the American people through online Social Networks.
Available as a PDF formatted for printing on 11x17 paper.

Wednesday
Jun112008

Democratic Party Voting Margins


New interactive infographic by Shan Carter and Amanda Cox on nytimes.com that shows the voter margins between Democratic candidates Hilary Clinton and Barrak Obama. These are based on exit poll data.


Choose any of the sorting criteria on the bottom, and then you can see specific data about any particular state by hovering the mouse over the blocks. The top chart shows how Men voted overall, and the second chart is how voters with No College Education voted.

Thanks Les for sending in the link!

Wednesday
Apr232008

Know your State Flag Infographics


From calorielab.com, is a humorous take-off of the flag infographics from Icaro Doria (Meet the World, Infographic Flags). These infographics based on U.S. state flags, although probably politically incorrect, are very funny.

Thanks to Mark from calorielab.com for sending in the link.

Saturday
Apr192008

Map of World Happiness


From geostrategis.com, the world's first map of world happiness.

This world map on happiness was distributed through a Globe and Mail article by Sheryl Ubelacker (28/07/06). It is an interesting perspective, but primarily focused on the social side of well being. It provides a strong visualization but lacks the substance to become a strategic or policy significant map. This map was prepared by Adrian White, University of Leicester

Wednesday
Mar192008

Iraq by the Numbers


From foreignpolicy.com, a really tall chart showing statistical information covering the last five years of the Iraq war. I'm not sure I like the idea of this big chart that covers so many different types of data. The information on the bottom half of the chart tends to get lost to the reader.

Tuesday
Feb262008

Infographics for Advocacy


I got a note from John Emerson, the author of Visualizing Information for Advocacy, and I wanted to share that his booklet on using infographics for NGO's and advocacy organizations is now available online as a free PDF (6.9MB) at apperceptive.com. Although geared to advocacy groups, the information is definitely relevant to everyone.

John also has a blog post up on Social Design Notes.

Outstanding job John!