About
Randy Krum
President of InfoNewt.
Data Visualization and Infographic Design

Infographic Design

Infographics Design | Presentations
Consulting | Data Visualizations

DFW DataViz Meetup

Join the DFW Data Visualization and Infographics Meetup Group if you're in the Dallas/Fort Worth area!

Search the Cool Infographics site

Custom Search

Subscriptions:


Feedburner

The Cool Infographics® Gallery:

How to add the
Cool Infographics button to your:

Cool Infographics iOS icon

- iPhone
- iPad
- iPod Touch


Read on Flipboard for iPad and iPhone

Featured in the Tech & Science category

Flipboard icon

Twitter Feed
From the Bookstore

Caffeine Poster

The Caffeine Poster infographic

Entries in size (39)

Tuesday
Jan082013

The Ultimate Complete Final Social Media Sizing Cheat Sheet

The Ultimate Complete Final Social Media Sizing Cheat Sheet infographic


The Ultimate Complete Final Social Media Sizing Cheat Sheet by LunaMetrics is a huge (and very long) informational infographic that shows the readers all of the important image sizing requirements for the major social networks.

In June of this year, we published an infographic listing all of the sizing information for images on Facebook, Twitter, Google+, and Pinterest. It was a wildly successful piece of content, totally blowing our expectations out of the water. Unfortunately, while its popularity has flourished, nearly every social network instituted changes to their image sizes, rendering most of the information on the infographic out of date.

We knew we needed to update the information on the cheat sheet, but we weren’t comfortable with simply adjusting one or two figures on the blog post and leaving it as-is. We’d also received a lot of feedback, both on the design and information it contained. We decided to redesign the entire sheet and incorporate a few more social networks.

We also decided to permanently redirect the old sheet here, so that shared tweets, pins, likes, and so on, would lead to the correct sizing dimensions. Additionally, as sizing changes are implemented across social networks, we’ll actively update this sheet – meaning that if you use the embed code at the bottom to share this sheet on your own site, the image will automatically update with changes as they are rolled out. No more out-of-date information.

I love that all of the sizes are shown in correctly proportional rectangles!  Based on their claim, this infographic should also update correctly as they revise it to match the ongiong changes from all of the social networks.  

Some color of the official logos of the different social media networks at each section break would have been helpful to the reader.  The light typeface used at each section break is hard to distinguish from the rest of the design.

Found on Social Media and Social Good

Friday
Nov092012

Car Sizes Through the Years

Car Sizes Through the Years infographic

It has been a gradual change, however it is definitely there. Our cars have gotten bigger. Automotive.com walks us through some of our favorite car’s growth spurts in the Car Sizes Through the Years infographic.

One of the great joys of living in Los Angeles is the wide variety of cars you see on the road. It provides a great contrast, especially when comparing between generations.

For example: a while back, news director Keith Buglewicz was driving down the freeway when he found himself behind a 2013 Ford Mustang, and its 1967 fastback equivalent. The modern Mustang dwarfed its predecessor in every dimension; comparatively speaking, it was mammoth.

When did cars get so big?

I really like this design.  It’s very focused on telling one story about the growing size of cars, and the design style is superb.  By using images and outlines of the actual cars, it tells the story much better than a bar chart would have because the images are recognizable to the reader which improves comprehension.

The design is missing some form of copyright statement and the URL link to the original infographic landing page so readers can find the high-resolution version when they see this posted on other sites.

Thanks to Chris for sending in the link

Friday
Jul132012

Exoplanets: 786 Known Planets

Exoplanets infographic

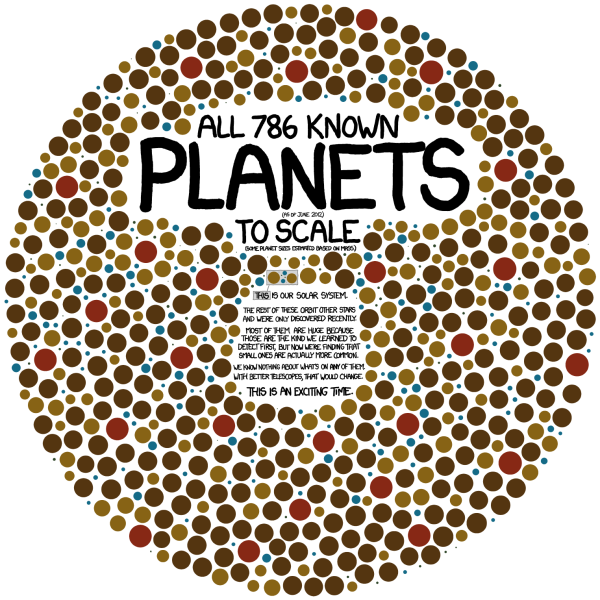
Exoplanets is a great infographic that tells one story really well by focusing on one data visualization for the whole story.  Randall Munroe at xkcd.com occasionally mixes in some great data visualizations and infographic designs with his comics.

All 786 known planets (as of June 2012) to scale (some planet sizes estimated based on mass).  

[Our solar system planets are shown in the middle]

The rest of these orbit other stars and were only discovered recently.  Most of them are huge because those are the kind we learned to detect first, but now we’re finding that small ones are actually more common.  We know nothing about what’s on any of them.  With better telescopes, that would change.  This is an exciting time.

This visual is so powerful.  You could write in text that we have found 786 extra-solar planet, but the visual helps the reader wrap their head around the scale of that large number and adds the size of the planets as a second level of information.

It’s also a clean design that focuses on communicating the scale of how many planets we have found, and doesn’t try to add all of the other information we know like which stars they orbit, what are their names, when were they discovered, which telescope found them, and who was the team or individual that discovered each one.  Just because we have more information doesn’t mean it should all be included in the infographic.  The story is cleaner and easier to understand without the clutter of too much information.

Cudos to Randall!

Friday
Apr132012

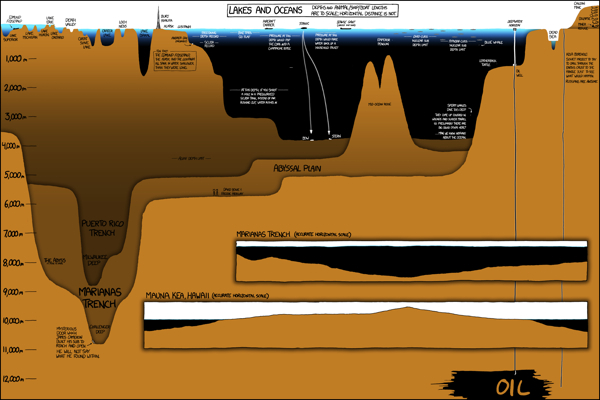
Lakes & Oceans: A Deep Infographic


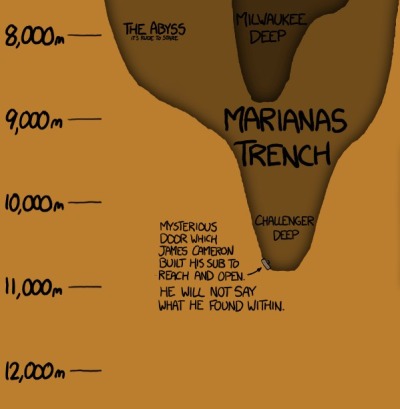
Another great infographic from Randall Munroe’s xkcd online comic.  Lakes & Oceans visualizes the various depths of the worlds water, and even includes…a mysterious door that James Cameron built his deep-sea submersible to reach at the bottom of the Marianas Trench and open?


Found on FlowingData.com

Thursday
Feb042010

The Scale of the Universe

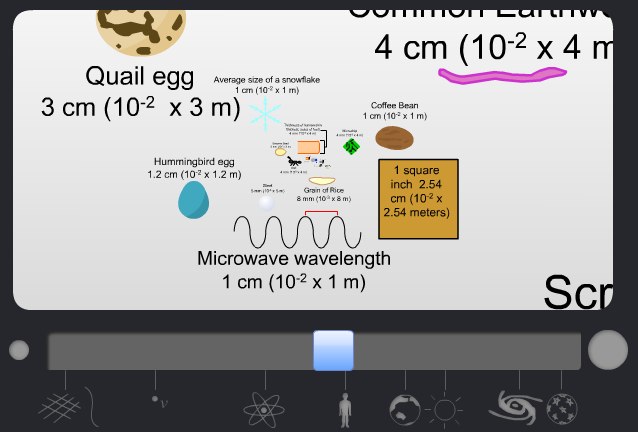
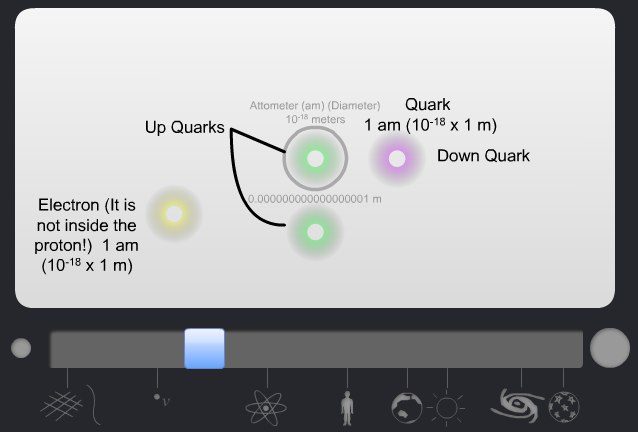
Check out this great flash animation, The Scale of the Universe, by Fotoshop in his portfolio on NewGrounds.com.  Like one of those infinite zoom images, this flash animation lets you zoom from 1x10-35 to 9.3x1026 by dragging the scroll bar across the bottom.

Since I’m visual, that’s from 0.00000000000000000000000000000000001 meters (the Plank Length) up to 930,000,000,000,000,000,000,000,000 meters (the estimated size of the universe).


Found on Forgetomori.com

Saturday
Jul112009

How Much is a Petabyte?


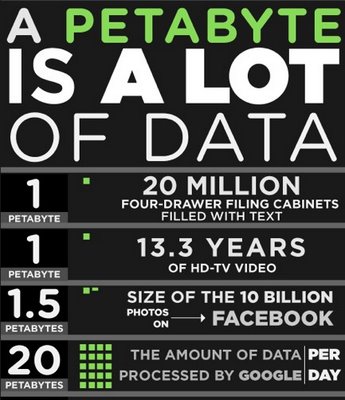
From Mozy.com, a pretty large infographic (as you might expect from the name).
We store a lot of data here at Mozy (15+ petabytes, in fact), but how much is that really? We put together this series of stats to help you understand just how much data that really is. Enjoy!
Thanks Matthew!

Monday
Mar022009

Taking the Train

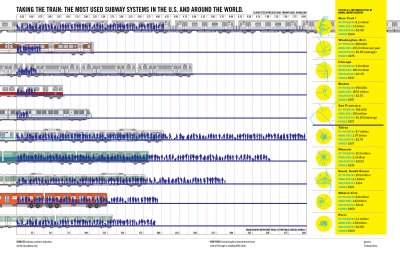
It's not a complicated one, but I like Good Magazine's summary of the biggest train systems in the world (top 5 U.S. cities and top 5 foreign cities).  The silhouettes represent the daily rides in the city, and the length of the train shows how many miles that system covers.  To the right is a quick map of each city's subway system and some statistics about their subway system.

Thanks Li, for sending in the link!

Wednesday
Dec242008

The Tallest Building: Burj Dubai


The Burj Dubai is a construction project to build the world's tallest building in Dubai.  Their website has a nice interactive comparison to the other key skyscrapers in the world.  The photo-like images on a black background with the reflection is very similar to the Apple Computer photo slideshows.
The goal of Burj Dubai is not simply to be the world's highest building.  It's to embody the world's highest aspirations.  Burj Dubai looks different depending on where you're standing.  For those living nearby, it is a shining accomplishment - tangible proof of Dubai's central role in a growing world.
Thanks Alwyn!

Wednesday
Oct292008

Classic infographic from 1823!


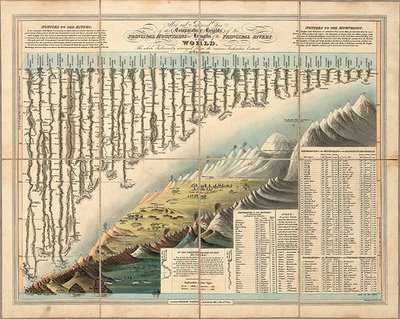
Here's a classic from 1823!  It a hand drawn infographic titled "Comparative Heights of the Principal Mountains and Lengths of the Principal Rivers of The World" by WR Gardner.  The high resolution image is on Flickr, but the post about the image is on bibliodyssey.blogspot.com.

This one makes a great poster!  Thanks Roi for sharing in the comments.

Monday
Oct202008

NEW Death and Taxes 2009 poster


New Death and Taxes infographic for 2009!  Interactive viewer let's you zoom in to see all of the details.
"Death and Taxes:2009" is a representational poster of the federal discretionary budget; the amount of money that is spent at the discretion of your elected representatives in Congress. Basically, your federal income taxes. The data is from the President's budget request for 2009. It will be debated, amended, and approved by Congress by October 1st to begin the fiscal year.

The poster provides a uniquely revealing look at our national priorities, that fluctuate yearly, according to the wishes of the President, the power of Congress, and the will of the people. If you pay taxes, then you have paid for a small part of everything in the poster. 
The Death and Taxes poster from 2007 was my initial post on Cool Infographics, so I'm very excited to see this update.  Now the 2009 version is available to purchase as a poster here.