About
Randy Krum
President of InfoNewt.
Data Visualization and Infographic Design

Infographic Design

Infographics Design | Presentations
Consulting | Data Visualizations

DFW DataViz Meetup

Join the DFW Data Visualization and Infographics Meetup Group if you're in the Dallas/Fort Worth area!

Search the Cool Infographics site

Custom Search

Subscriptions:


Feedburner

The Cool Infographics® Gallery:

How to add the
Cool Infographics button to your:

Cool Infographics iOS icon

- iPhone
- iPad
- iPod Touch


Read on Flipboard for iPad and iPhone

Featured in the Tech & Science category

Flipboard icon

Twitter Feed
From the Bookstore

Caffeine Poster

The Caffeine Poster infographic

Entries in size (39)

Friday
Jul182008

Who Owns the West?


Found on digg.com, this map was posted on strangemaps.com.  The portion of each state shows the amount of land in each state owned by the Federal Government, but not the specific location.  It's centered in each state just to show the relative size.


This map appeared as an illustration to ‘Can the West Lead Us To A Better Place?‘, an article in Stanford Magazine, a periodical for and about alumni from that university.

Friday
May162008

Global Distribution of Water


From the United Nations Environment Programme website, the Global Distribution of Water specifically highlights the scarcity of freshwater.

Found on digg.com

Monday
Apr142008

Treemaps for drive space

I don't think I've posted much about specific software programs, but there are a number of infographic programs that anyone can use. These two are programs that analyze what's on your hard drive, and show it you in a treemap display.

The one above is Disk Inventory X for the Mac (which I use), and the one below is WinDirStat for Windows. Both are free, and are real-life examples of how you can use infographics in your life. So take a minute, and clean off some of that old junk taking up space on your hard drive.

Tuesday
Apr012008

Visualizing Pi (π)


Cool little GIF animation to visualize the value of Pi (π) from Wikipedia. Click the image to view the animation.

Found on digg.com

Monday
Mar032008

The Calculators of HP poster


From the The Hewlett Packard Calculator Page.

This poster shows every HP calculator made starting with the famous HP-35. Each calculator is displayed with it's production start and end data, and it's project codename.
It's amazing how many of these I have actually used. This is similar to the Evolution of Apple Design...but with more buttons.

Friday
Feb082008

How many employees does Google have?

16,805 full-time employees worldwide as of December 31, 2007, Google says. Here on blogscoped.com visualized with one icon per person. It's a big image.

Found on Infosthetics.

Thursday
Jan172008

Map of European Languages


This is a great map, found on Photobucket.com uploaded by the user pizzler. In the U.S. we understand that other countries sometimes speak foreign languages, but we have the advantage that all 50 states speak the same language (or at least a similar version of the same language). So it's somewhat of an abstract concept to most Americans. And European geography isn't exactly a major topic in the U.S. school system, so most people don't understand how many countries there are, and especially how small some of them are.

This visual map really helps convey the diversity within the EU. It maps 46 languages across the European continent, and I know there are more. I can't imagine how difficult it must be for the EU to actually get anything done between countries.

Tuesday
Jan012008

Smoking Kills 200,000 Every 6 Months


Skull With Cigarette, 2007 [based on a painting by Van Gogh]
72x98"

Depicts 200,000 packs of cigarettes, equal to the number of Americans who die from cigarette smoking every six months.

I've become a big fan of Chris Jordan's work, especially the Running The Numbers series. I just noticed that he has added to the collection on his website with some new pieces! A friend of mine quit smoking this week, so in her honor I want to share one of the new artwork pieces.

Sunday
Dec232007

Miraculous Logistics Behind Operation Christmas


Holiday Infoporn from Wired.com.

Here's our theory: There is, in fact, a nonsupernatural Santa. It's a transnational corporation with one mission-critical fulfillment goal: Every kid who celebrates the holiday gets a toy on Christmas eve.
Check out the side-scrolling timeline at the bottom. I think they should have included Chinese New Year.

Saturday
Dec222007

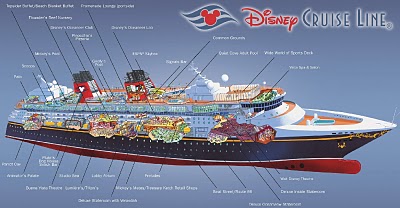
The Disney Cruise Line Cut-Away


The family took our first Disney Cruise this year, which was fantastic! Here’s a great cut-away graphic of the Disney Wonder, but the other ship, the Disney Magic is almost identical. This graphic is a little out of date, because some things have changed. The ESPN Skybox is now a teen area called The Stack or Aloft depending on which ship you’re on.

The ship is actually quite large, so the spacial representation of locations is really helpful. You can get turned around very easily.