Gov 2.0 Infographic: Bringing the Tobacco Control Act to Life
In 2011, Enspektos, a health marketing communications innovation consultancy, invited InfoNewt (my company) to be involved in a special project the firm was leading on behalf of the Food and Drug Administration’s (FDA) Center for Tobacco Products (CTP). As a new federal agency, the CTP is tasked with regulating tobacco products and preventing tobacco use – especially among youth.
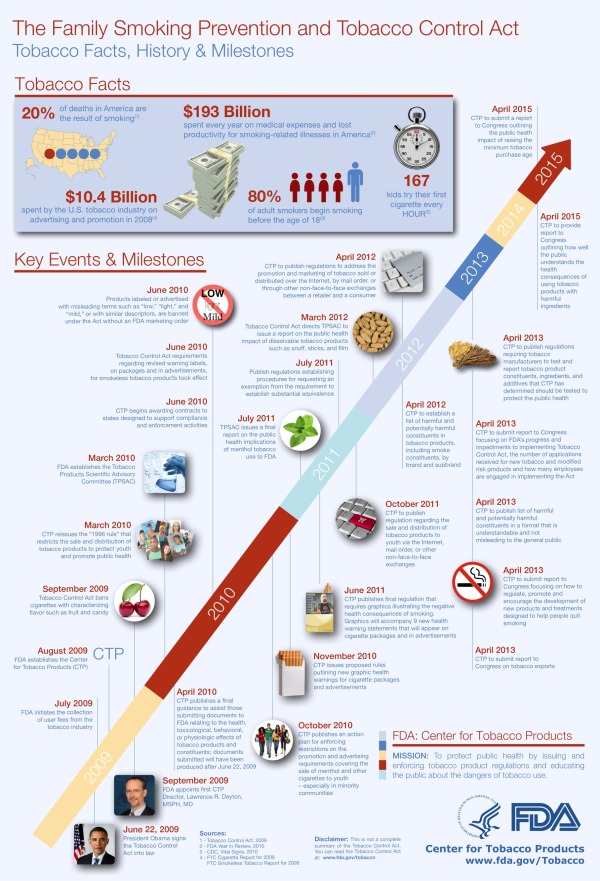
During the project, we collaborated with the CTP to help create The Family Smoking Prevention and Tobacco Control Act: Facts, History and Milestones, an infographic timeline that covers the past and future actions related to the Tobacco Control Act passed in 2009.
The Family Smoking Prevention and Tobacco Control Act (Tobacco Control Act) is an important piece of legislation with many requirements. This infographic illustrates the history, rationale and major events associated with the Act. The Tobacco Control Act provides all of the events, deadlines and requirements in full and should be used as the final resource for information about the Act.
The infographic is yet another example of Gov 2.0, or the effort to utilize a range of digital technologies to improve government transparency and public understanding of how federal agencies function. The original Tobacco Control Act is a 68-page document available online, but in actual practice that isn’t easily accessible or understandable by the general public. The FDA has created several tools to help the public understand the Tobacco Control Act, like a snapshot overview of the Act, an interactive scrolling timeline viewer, a searchable interface and the infographic timeline.

On Wednesday, April 25th, the FDA is holding a LIVE webinar to share the different tools they have created to help everyone access and understand specific information from the 68-page law.
Attend Our Live Webinar!
- Wednesday, April 25, 2012, 1 – 2 p.m. EST.
- Visit https://collaboration.fda.gov/tobaccocontrolact to login to the webinar. (turn up your speakers for audio).
- For audio, dial 1-888-989-6520; passcode: 2397828.
As you might expect from an official government publication, the design went through many iterations of review and revisions. In my opinion, the final infographic is text-heavy, but strikes a balance between optimal design and content that was vetted and approved by many different individuals at the CTP.
Fard Johnmar, Founder and President of Enspektos agreed to answer some questions about the project.
Cool Infographics: How do you think the infographic and other tools will aid public understanding of the Tobacco Control Act and the CTP?
Fard Johnmar: I think the infographic and other tools are an important step for the federal government. Transforming dense and complicated legislation into simple, visually appealing information products is a very difficult process. You have to balance the wish to make things clear and concise with a requirement that information be as accurate and complete as possible.
We had two primary goals: The first was to improve the public’s understanding of the Tobacco Control Act. The second was to get people within FDA comfortable with using new tools that help visually communicate important regulatory and public health information. Now that this project is complete, I think FDA will be looking for other ways to communicate about its mission and activities in more visually appealing ways.
Cool Infographics: Do you see other health and medical organizations using visual communications techniques?
Fard Johnmar: Absolutely. In fact, since we published the Empowered E-Patient infographic a few years ago, I’ve seen a number of health organizations using infographics to communicate about a range of topics, including GE for its Healthymagination project (click here for a few sample infographics).
Cool Infographics: How difficult was it to push the infographic through the FDA approval process
Fard Johnmar: As you can imagine, getting final approval for a novel visual project like this can be difficult for large organizations. However, there was a real passion for the project from Sanjay Koyani, Senior Communications Advisor at the CTP and other members of his team. They helped to successfully meet all of the legal requirements and answer the numerous questions posed by colleagues at the CTP. Now there is a higher comfort level at the agency with utilizing these types of visual tools to tell the CTP story.
I truly appreciated being involved in the project, and think this is a really big step towards making the often overly complex information released through official government channels more understandable to more people.
Thanks to Enspektos and the team at the Center for Tobacco Products!
 InfoNewt,
  Infographic,
  client,
  communication,
  design,
  government,
  history,
  interview,
  online,
  smoking,
  timeline,
  transparency


