About
Randy Krum
President of InfoNewt.
Data Visualization and Infographic Design

Infographic Design

Infographics Design | Presentations
Consulting | Data Visualizations

DFW DataViz Meetup

Join the DFW Data Visualization and Infographics Meetup Group if you're in the Dallas/Fort Worth area!

Search the Cool Infographics site

Custom Search

Subscriptions:


Feedburner

The Cool Infographics® Gallery:

How to add the
Cool Infographics button to your:

Cool Infographics iOS icon

- iPhone
- iPad
- iPod Touch


Read on Flipboard for iPad and iPhone

Featured in the Tech & Science category

Flipboard icon

Twitter Feed
From the Bookstore

Caffeine Poster

The Caffeine Poster infographic

Entries in communication (5)

Monday
Nov302015

A History of Communication

A History of Communication infographic

Communication is just as important to us today as it was in prehistoric times. The need hasn't changed much, but the way we accomplish it sure have! A History of Communication infographic from Thinking Phones divides our technological advances in communication into 4 eras, and then leaves us with the question of, "What's next?"

From the primitive use of smoke signals to today's cutting-edge contextual phone calls, humans have proved there are no boundaries when it comes to advancing the methods with which we communicate. Personally and professionally, we are constantly adopting new interactive technologies for the purpose of getting ahead – to make our lives simpler in a more convenient, intelligent way. Today's innovative communication platforms like text, voice, video, and complete cloud solutions easily enable this goal of efficient and effective contact. As our connectivity needs evolve and technology continues to expand, we humbly take a look back through the history of communication as we know it. 

Simple timeline that highlights the key milestones of communication at a very high level. Minimal detail and text keeps the design clean and easy-to-read.

Thanks to Stephanie for sending in the link!

Monday
Aug112014

12 Reasons Your Business Needs to Get Visual

12 Reasons Your Business Needs to Get Visual infographic

If we’ve said it once, we’ve said it a million times… but once more wont hurt! Visuals are important!!! This infographic from re:DESIGN attempts to summarize the reasons why in 12 Reasons Your Business Needs to Get Visual.

The shift to the visual is evident everywhere we look, in all media — the infographic explains why.

A good, strong visual married to a good concept — with the right strategy and the right words — wins every time, especially in today’s busy, noisy media world. One thing is clear: visuals and all that traditional creative expertise brings to the table has never been more important for capturing eyeballs, expanding brand influence, and getting people to act.

Love the message and most of the points included.  Good choice of images for each section. However, big fonts are not data visualizations and the infographic looks like it’s pushing the use of bigger fonts instead of visuals. Data shown in a big font does not provide the audience with any context, not do they make the data easier to understand.

I also noticed the popular false statistic included in the design: “Visual data is processed by the brain 60,000 times faster than text.”  It’s a statistic often quoted in presentations and infographics about the value of visual information, but it’s not true.  I’d love for this statistic to be real, but no one has been able to track down the original research.  It was used decades ago in some 3M marketing materials for transparencies used with overhead projectors (yes, that long ago).  It’s quoted so often now that everyone believes it.

If this topic interestes you, check out Chapter 1 of my book, Cool Infographics, called The Science of Infographics.  There I cover the research and data behind why visual information is more effective and why infographics are so popular.  You can download a free sample PDF of the chapter on the BOOK page.

Found on re:DESIGN

Thursday
Sep192013

A Visual Guide to What Colors Communicate

The Essential Guide to What Colors Communicate infographic

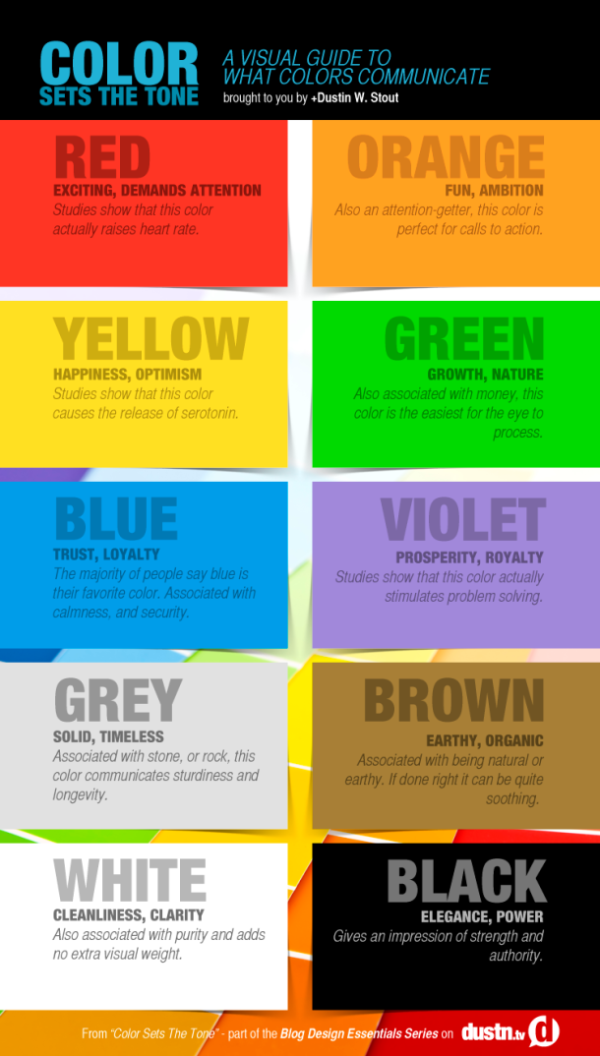
When you are designing your blog or website, how do you decide what colors to use? Your choice will make a difference on how others receive and interpret your content. Dustin Stout from dustn.tv has created Color Sets the Tone: A Visual Guide to What Colors Communicate infographic to educate website builders and bloggers on how to communicate to their readers with color.

Did you know that colors communicate? The use of color in your blog design can be an essential part of how your personal brand is perceived. Color usage can either make or break your blog design, and I will show you how to choose your colors wisely by understanding what they communicate.

When new visitors land on your blog, the first things they interpret are colors. Before they read a single character, their brain is registering colors which are subconsciously (or consciously) tied to emotions, states of mind, or [preconceived ideas]. If you do a poor job at putting together the colors in your blog design, it can be detrimental to the growth of your brand.

I’ve come up with an essential guide to what colors communicate, as well as a quick infographic to reference that is free to download! 

Simple design that tells one story really well.  Quick and easy for readers to digest, and the text associated with each color is really short.  Less text is better for infographics.

The footer should include the URL back to the landing page to make it easier for readers to find the full-size original version.

Found on http://dustn.tv/what-colors-communicate/

Tuesday
Apr242012

Gov 2.0 Infographic: Bringing the Tobacco Control Act to Life


In 2011, Enspektos, a health marketing communications innovation consultancy, invited InfoNewt (my company) to be involved in a special project the firm was leading on behalf of the Food and Drug Administration’s (FDA) Center for Tobacco Products (CTP).  As a new federal agency, the CTP is tasked with regulating tobacco products and preventing tobacco use – especially among youth.

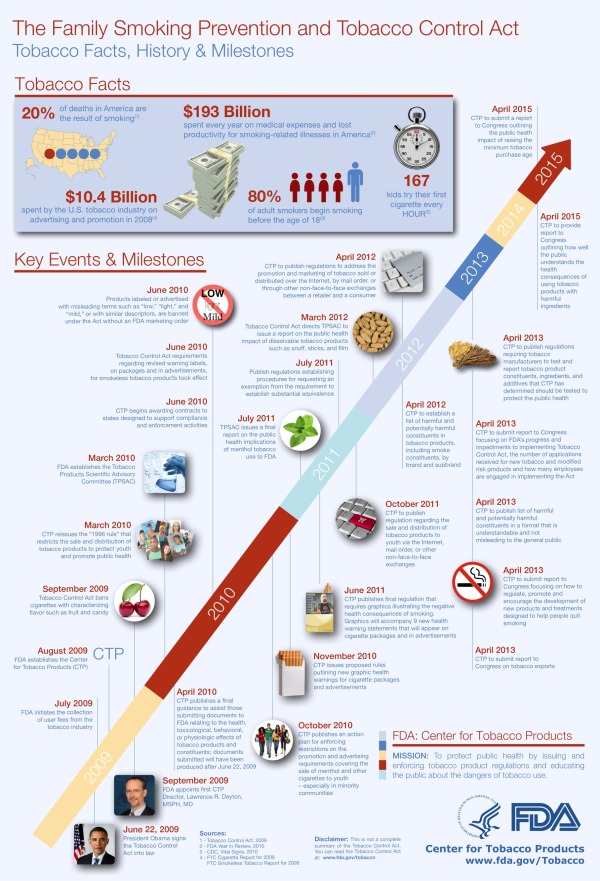
During the project, we collaborated with the CTP to help create The Family Smoking Prevention and Tobacco Control Act: Facts, History and Milestones, an infographic timeline that covers the past and future actions related to the Tobacco Control Act passed in 2009.

The Family Smoking Prevention and Tobacco Control Act (Tobacco Control Act) is an important piece of legislation with many requirements. This infographic illustrates the history, rationale and major events associated with the Act. The Tobacco Control Act provides all of the events, deadlines and requirements in full and should be used as the final resource for information about the Act.

The infographic is yet another example of Gov 2.0, or the effort to utilize a range of digital technologies to improve government transparency and public understanding of how federal agencies function.  The original Tobacco Control Act is a 68-page document available online, but in actual practice that isn’t easily accessible or understandable by the general public.  The FDA has created several tools to help the public understand the Tobacco Control Act, like a snapshot overview of the Act, an interactive scrolling timeline viewer, a searchable interface and the infographic timeline.

On Wednesday, April 25th, the FDA is holding a LIVE webinar to share the different tools they have created to help everyone access and understand specific information from the 68-page law. 

Attend Our Live Webinar!

As you might expect from an official government publication, the design went through many iterations of review and revisions.  In my opinion, the final infographic is text-heavy, but strikes a balance between optimal design and content that was vetted and approved by many different individuals at the CTP. 

Fard Johnmar, Founder and President of Enspektos agreed to answer some questions about the project.

Cool Infographics: How do you think the infographic and other tools will aid public understanding of the Tobacco Control Act and the CTP? 

Fard Johnmar:  I think the infographic and other tools are an important step for the federal government.  Transforming dense and complicated legislation into simple, visually appealing information products is a very difficult process.  You have to balance the wish to make things clear and concise with a requirement that information be as accurate and complete as possible.  

We had two primary goals: The first was to improve the public’s understanding of the Tobacco Control Act.  The second was to get people within FDA comfortable with using new tools that help visually communicate important regulatory and public health information.  Now that this project is complete, I think FDA will be looking for other ways to communicate about its mission and activities in more visually appealing ways.

Cool Infographics: Do you see other health and medical organizations using visual communications techniques? 

Fard Johnmar: Absolutely.  In fact, since we published the Empowered E-Patient infographic a few years ago, I’ve seen a number of health organizations using infographics to communicate about a range of topics, including GE for its Healthymagination project (click here for a few sample infographics).

Cool Infographics:  How difficult was it to push the infographic through the FDA approval process

Fard Johnmar: As you can imagine, getting final approval for a novel visual project like this can be difficult for large organizations.  However, there was a real passion for the project from Sanjay Koyani, Senior Communications Advisor at the CTP and other members of his team.  They helped to successfully meet all of the legal requirements and answer the numerous questions posed by colleagues at the CTP.  Now there is a higher comfort level at the agency with utilizing these types of visual tools to tell the CTP story.

I truly appreciated being involved in the project, and think this is a really big step towards making the often overly complex information released through official government channels more understandable to more people.

Thanks to Enspektos and the team at the Center for Tobacco Products!

Thursday
Feb232012

Hand Jive: Gestures That Can Get You in Trouble Abroad

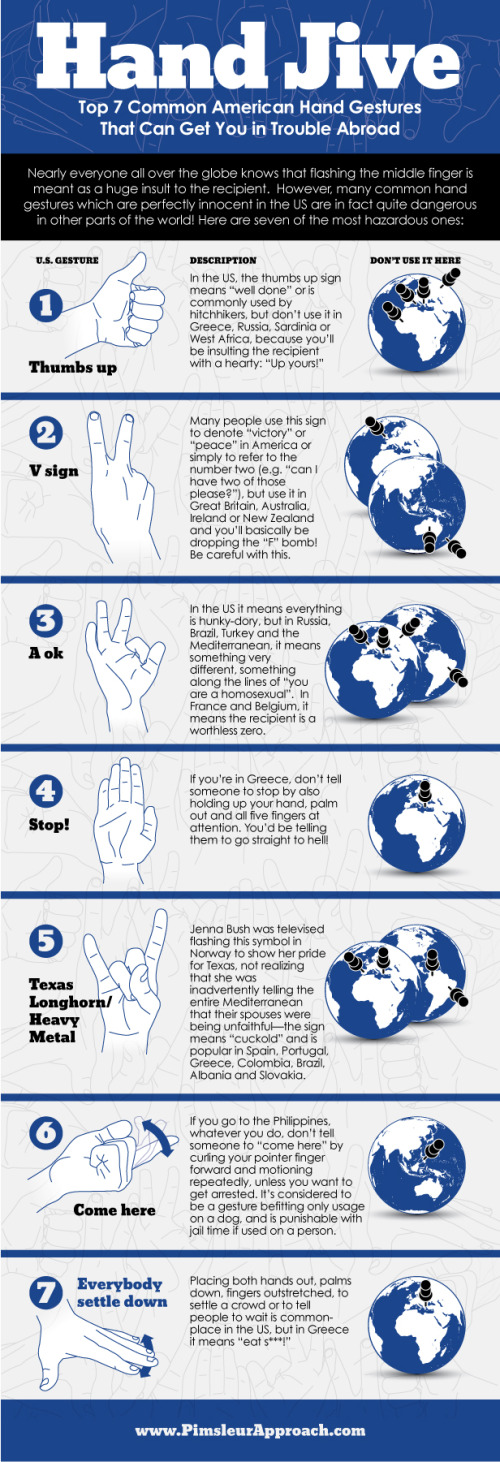
The Hand Jive-Hand Gestures Infographic from Pimsleur Approach takes you on a world tour of what common hand gestures from America mean elsewhere (for better or worse).

Nearly everyone all over the globe know that flashing the middle finger is meant as a huge insult to the recipient. However, many common hand gestures which are perfectly innocent in the US are in fact quite dangerous in other parts of the world!

This is a great topic for an infographic because it’s so visual.  You have to show the actual gestures as illustrations in order to communicate effectively with the reader.  The pins in the globes are easy to read, and a refreshing visual that’s different from the standard flags on a map.

Simple message, focused topic, easy to understand.  Good design.  For an infographic, the URL at the bottom should link you directly to the original infographic posting instead of the company front page, and some type of coyright statement is missing.

Thanks to Sarah for sending in the link!