About
Randy Krum
President of InfoNewt.
Data Visualization and Infographic Design

Infographic Design

Infographics Design | Presentations
Consulting | Data Visualizations

DFW DataViz Meetup

Join the DFW Data Visualization and Infographics Meetup Group if you're in the Dallas/Fort Worth area!

Search the Cool Infographics site

Custom Search

Subscriptions:


Feedburner

The Cool Infographics® Gallery:

How to add the
Cool Infographics button to your:

Cool Infographics iOS icon

- iPhone
- iPad
- iPod Touch


Read on Flipboard for iPad and iPhone

Featured in the Tech & Science category

Flipboard icon

Twitter Feed
From the Bookstore

Caffeine Poster

The Caffeine Poster infographic

Entries in spending (78)

Friday
Aug012008

Small Gambling Addiction Spending Visual

I love this very simple but powerful visual comparison of the gambling revenues and the money spent on gambling addiction support programs.  The author is only trying to communcate one point, and gets his message across very stongly.  I believe it was done by Tim Broderick, from the Daily Herald.

Found on InfographicsNews.blogspot.com.  Looks like

Wednesday
Jul022008

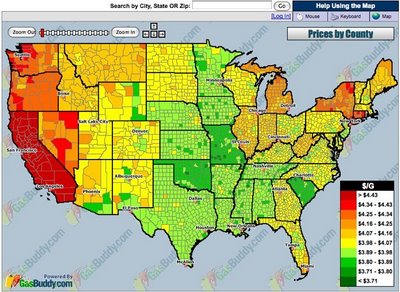
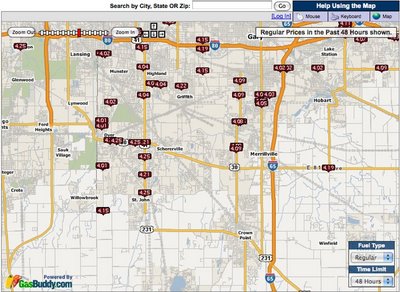
Map of Local Gas Prices

GasBuddy.com has a cool interactive temperature map of gas prices across the U.S. and Canada that allows you to zoom in to the street level to see prices at specific gas stations.  Prices are all removed from the database when they become over 72 hours old to keep the map current.


Thanks for sending in the link Karen!

Monday
Jun232008

Obama Funding Graphic


A small poster from our friends at XPLANE,

How Obama Reinvented Campaign Finance Barack Obama is the first major candidate to decline participation in the public financing system for presidential campaigns. He’s found a more effective way to raise money — by leveraging the power of the American people through online Social Networks.
Available as a PDF formatted for printing on 11x17 paper.

Monday
Jun162008

The Cost of Gadgets


From Wired.com, this is really a 3-dimensional chart. I liked it because there are very few 3D charts that actually portray 3 dimensions of data. (This is actually 4D if you include the different products as a dimension) Usually 3D charts are just bad use of chart styles from PowerPoint. I also like the perspective from above. Although unusual, it helps to see the whole chart.

Tuesday
Jun032008

The Infographic that Saved a Million Lives


Great story from 37signals.com about a very simple infographic that motivated Bill and Melinda Gates to change the focus of their charity spending.

“No graphic in human history has saved so many lives in Africa and Asia,” says NY Times columnist Nicholas Kristof about an infographic in a ‘97 Times article that spurred Bill and Melinda Gates to take action on public health.

...But then bill confessed that actually it wasn’t the article itself that had grabbed him so much—it was the graphic. It was just a two column, inside graphic, very simple, listing third world health problems and how many people they kill. but he remembered it after all those years and said that it was the single thing that got him redirected toward public health.

Monday
May262008

In the Shadow of Foreclosures


Great graphic from NYTimes.com showing the subprime mortgage foreclosures as a percentage of all subprime mortgages by geographic region of the country.

Monday
May052008

Where Does the Money Go?


From the nytimes.com, this graphic visually represents how average consumer spending breaks down, and the color code shows how much spending in that category has changed in the last year. For example, Gasoline is 5.2% of an average consumer's spending, and it has risen 26% from 2007 to 2008.

As far as I can tell, this is actually a treemap, but in a new shape. More details pop-up when you mouse over each of the individual shapes.

Thanks to Tony, for sending in the link.

Thursday
Feb282008

Classifying Experiences


Stephen Anderson is an "experience architect" at Sabre Travel Network, and has created a poster to communicate how people Sort, Classify, and Label Experiences. Read Stephen's blog post explaining his efforts.

Found on NiXLOG.

Tuesday
Jan222008

Nichloas Felton's 2007 Annual Report


Nicholas Felton has published his new 2007 Annual Report. I love the way he breaks down his own personal life into maps and charts. I had just posted about his 2006 Annual Report last month.

Monday
Jan212008

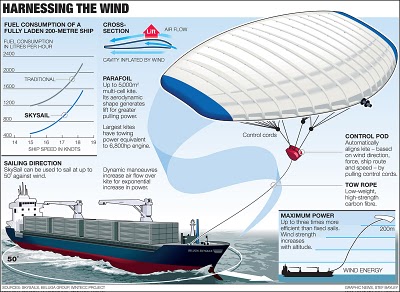
Harnessing the Wind


From the Telegraph in the UK, the idea is to use a kite to help pull a ship across the ocean. by using the wind power at high altitudes the ship would save on energy consumption.

Its inventor, Stephan Wrage, a 34-year-old German engineer, claims the kite will significantly reduce carbon emissions, cutting diesel consumption by up to 20 per cent and saving £800 a day in fuel costs.
Found on digg.com