About
Randy Krum
President of InfoNewt.
Data Visualization and Infographic Design

Infographic Design

Infographics Design | Presentations
Consulting | Data Visualizations

DFW DataViz Meetup

Join the DFW Data Visualization and Infographics Meetup Group if you're in the Dallas/Fort Worth area!

Search the Cool Infographics site

Custom Search

Subscriptions:


Feedburner

The Cool Infographics® Gallery:

How to add the
Cool Infographics button to your:

Cool Infographics iOS icon

- iPhone
- iPad
- iPod Touch


Read on Flipboard for iPad and iPhone

Featured in the Tech & Science category

Flipboard icon

Twitter Feed
From the Bookstore

Caffeine Poster

The Caffeine Poster infographic

Entries in spending (78)

Wednesday
Jan162008

The Price of Gasoline

This image was real popular on Digg.com this week. It's hosted on tinypic.com, but there's no author listed.

I love simple infographics like this that use a visual metaphor to instantly get the point across. You can tell someone that the price of gas is comparable with Coke, but putting gas in the Coke signature bottle will get more people to understand the message.

My own reaction was probably the opposite of what the author intended. My first thought is "Coke costs how much?!?" I know there is a lot more expense in producing gasoline than there is in producing Coke. They must really be marking the price up a lot for brown sugar-water.

There is a similar analogy in the U.S. regarding bottled water. Some bottled water brands are now more expensive than gasoline! How is that possible?!?

Tuesday
Oct302007

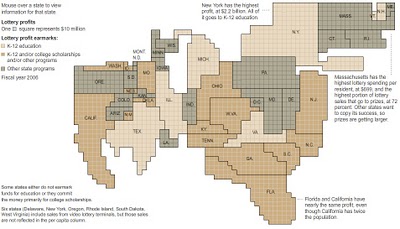
Lotteries Profit, but Do Students?


Interactive graphic, from the NYTimes:

Lotteries in 42 states and the District of Columbia rake in billions of dollars, but much of the cash from ticket sales gets channeled back into prizes and lottery administration. States earmark the profits for programs like education, but the lottery dollars contribute only a small percentage of the total education funding.

Sunday
Sep092007

The Wealthiest Americans Ever


From the NYTimes in July 2007, an interactive infographic ranking the Wealthiest Americans after you convert their fortunes to today's dollars using the relative share of G.D.P.

Scrolling your pointer over the photos or the fortune amount shows more detail of the individual. Lots of black & white portraits! Only current rich folk Bill Gates and Warren Buffet made the list with color portraits.

Saturday
Aug252007

Consumer Spending (5% on Tech Stuff)


From Wired magazine (issue 15.08) a treemap infographic of consumer spending in 2005. 5% of all consumer spending was on technology, and of course, Wired broke down that 5% into an expanded treemap.

Internet access +216%, Residential phone -25%. VOIP seems to be making an impact.

Tuesday
Jul242007

Consumer Product Jungle


unaesthetic.net has posted this fantastic high-res image of a grocery store. This is the nightmare of working in consumer products (like I do). The challenge is getting your product to stand out in this jungle and getting the consumers' attention.

This is a different type of infographic. There are no numbers or values, but you still get the message. Consumer products is a hard business.

This is now hanging on the wall in my office. A constant reminder of all the noise that our products must get through to reach a consumer.

Sunday
Jul222007

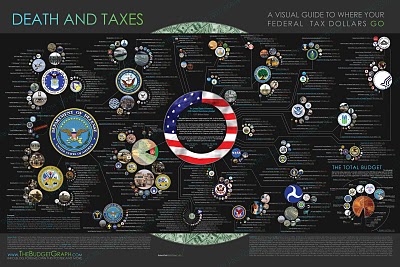
Death and Taxes 2008

NEW Death and Taxes infographic for 2008!


It is the 2008 Federal discretionary budget of the United States. is a representational poster of the federal discretionary budget; the amount of money that is spent at the discretion of your elected representatives in Congress. Basically, your federal income taxes. The data is from the President's budget request for 2008. It will be debated, amended, and approved by Congress by October 1st to begin the fiscal year.
So this is what the President is asking for, not the final budget. Compare this to the final 2007 discretionary budget from my earlier post.

An interactive Flash version is online at www.thebudgetgraph.com/poster.

Saturday
Jul212007

Top Presidential Contributions 1Q


It's early for the 2008 election, but major campaign funding has already started. It will be interesting to see if more money early in the race makes a difference in the outcome.

From washingtonpost.com

Sunday
Jul152007

Death and Taxes 2007


One of my favorite infographics is the Death and Taxes series.

This infographic visually breaks down the US Federal Discretionary Budget for 2007 into smaller and smaller bubbles. The actual values are also included as text, but the size of the bubbles instantly gives you an understanding of how the different budget items compare.

An online version in Flash is also available at thebudgetgraph.com

Just to be clear, this only shows the Discretionary Budget which totals $938 Billion. The total budget is $2.8 Trillion. Notice the circle in the background (just barely visible at the top and bottom) showing the National Debt of $9.35 Trillion.

One older version is the 2004 Budget.

Page 1 ... 4 5 6 7 8