About
Randy Krum
President of InfoNewt.
Data Visualization and Infographic Design

Infographic Design

Infographics Design | Presentations
Consulting | Data Visualizations

DFW DataViz Meetup

Join the DFW Data Visualization and Infographics Meetup Group if you're in the Dallas/Fort Worth area!

Search the Cool Infographics site

Custom Search

Subscriptions:


Feedburner

The Cool Infographics® Gallery:

How to add the
Cool Infographics button to your:

Cool Infographics iOS icon

- iPhone
- iPad
- iPod Touch


Read on Flipboard for iPad and iPhone

Featured in the Tech & Science category

Flipboard icon

Twitter Feed
From the Bookstore

Caffeine Poster

The Caffeine Poster infographic

Entries by Randy (1654)

Friday
Feb222008

National Gruntledness Index


New interactive map on CareerBuilder.com charts the results of user survey data on how gruntled (or disgruntled) people are with their jobs across the country. You can even narrow the map results to a particular industry.

The map doesn't change that often, but when you roll your mouse over the map, it highlights the cities where the score has changed.

Thanks Kevin for the email.

Wednesday
Feb202008

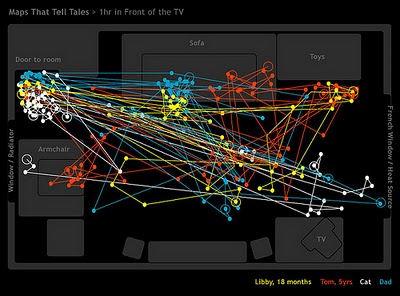
Family Movement Map


Cool infographic project on Flickr, this map of the living room tracks the movements of a family over the course of only one hour on Christmas Day in 2006. Posted on Flickr by The Bumblebee.

Thanks Oliver for sending me the link.

Tuesday
Feb192008

Meet The World, Infographic Flags


Meet The World is an infographic project that uses the colors of eight national flags to represent some of the current issues in the world.

Icaro Doria is Brazilian, 25 and has been working for the magazine Grande Reportagem, in Lisbon, Portugal, for the last 3 years. He is part of the team (with Luis Silva Dias, João Roque, Andrea Vallenti and João Roque) that produced the flags campaign which has been circulating the Earth in chain letters via e-mail.
I found the link to this on rc3.org.

Monday
Feb182008

GE Ecomagination Blueprint Ads

GE is running The Blueprint Series of five print ads combining photos with an overlay of infographics. This works really nicely because they kept the infographics relatively simple.

Found on notcot.com.

Sunday
Feb172008

Motion Graphics: Ocean's Thirteen

Made by Mattias Berlamont as a class project, this quick video integrates text and simple animation to a scene from the movie Ocean's Thirteen.

Great job Mattias!

Saturday
Feb162008

LEGO Brick 50th Anniversary Timeline


Neat timeline of the 50-year history of LEGO bricks. The photos of the bricks as they were in each time period really makes this a great timeline. Plus, LEGOs are just fun.

Found on digg.com

Friday
Feb152008

5,000 years of Faith


From mapsofwar.com, this is a 90-second flash video showing when the major religions formed and where they spread across the globe. Great combination of a map with a timeline.

Found on digg.com

Wednesday
Feb132008

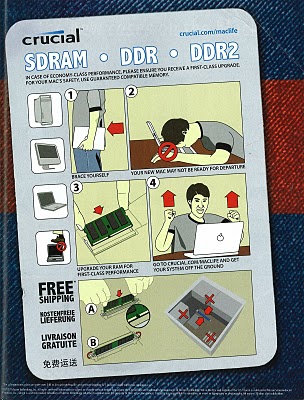
Crucial Memory Ad


Crucial Memory, has this ad running in Mac magazines right now. It's amusing, but not actually informative. The infographics aren't the real directions to install memory. Instead, its an infographic style that tells the consumer they will be happier if they install more memory. I like it because the infographic style adds credibility.

Monday
Feb112008

The Timeline of "Cool"


Found on Wikipedia, this is the timeline of what was "Cool" from 1500 A.D. through today. Apparently, the Beatles aren't cool anymore...

Saturday
Feb092008

Concentric Circle Disaster


Breaking News: Series Of Concentric Circles Emanating From Glowing Red Dot

This had one had me laughing out loud. From theonion.com, a news parody of how disasters are covered on TV using infographics. Watch out for those circles!

Found on Infosthetics.