About
Randy Krum
President of InfoNewt.
Data Visualization and Infographic Design

Infographic Design

Infographics Design | Presentations
Consulting | Data Visualizations

DFW DataViz Meetup

Join the DFW Data Visualization and Infographics Meetup Group if you're in the Dallas/Fort Worth area!

Search the Cool Infographics site

Custom Search

Subscriptions:


Feedburner

The Cool Infographics® Gallery:

How to add the
Cool Infographics button to your:

Cool Infographics iOS icon

- iPhone
- iPad
- iPod Touch


Read on Flipboard for iPad and iPhone

Featured in the Tech & Science category

Flipboard icon

Twitter Feed
From the Bookstore

Caffeine Poster

The Caffeine Poster infographic

Tuesday
Oct302007

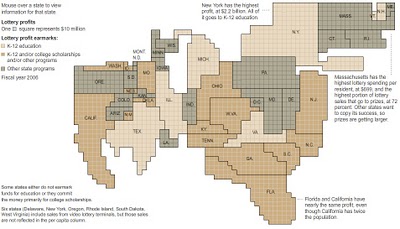
Lotteries Profit, but Do Students?


Interactive graphic, from the NYTimes:

Lotteries in 42 states and the District of Columbia rake in billions of dollars, but much of the cash from ticket sales gets channeled back into prizes and lottery administration. States earmark the profits for programs like education, but the lottery dollars contribute only a small percentage of the total education funding.

Sunday
Oct282007

Where we live...


Found on Data Mining, this is an interactive graphic from Time magazine showing the population density in America as a histogram. Similar to my earlier post on World Population Density, this one focuses on just America, and adds the 3d element to the visual.

Friday
Oct262007

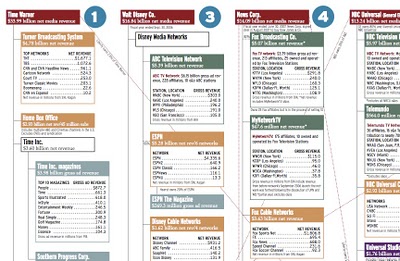
Who Owns the Media Companies?


Similar to my earlier post about Who Owns the Car Companies?, I found that Advertising Age magazine has created a poster showing the ownership in the media companies.

You thought the car companies were complicated...

Friday
Oct262007

Science Related Wikipedian Activity


A new visualization from the same group that did the earlier visualization of Wikipedia revision activity. This one focused on science and tech related articles. The mystery is the significance of the blue/green band that crosses the map.

Thursday
Oct252007

Map of the Internet (blacklisted)

Found on Information Aesthetics, this is a map of all 4,294,967,296 IP addresses in the world. Blocks of addresses are shown grouped together in squares based on the owner (ISP, corporation, goverment, university, etc.), and individual addresses are shown as grey dots. The IP addresses that are listed on the Spamhaus XBL blacklist are shown as red dots, representing suspect addresses.

Tuesday
Oct232007

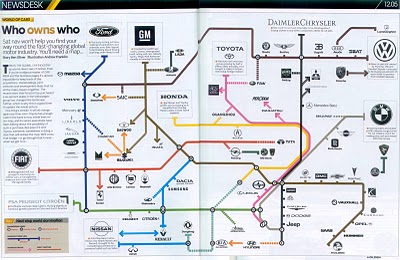
Who Owns the Car Companies?

I found three different images showing the complex network of ownership between the automotive companies. Three different attempts at making these complex relationships easier to understand. This first one is a scan from a magazine, but I can't find any reference to which actual magazine it came from. Charted out like a subway map, it's pretty easy to follow.

This next one from Too Many Cars is charted like a family tree, or a mind map. It's the easiest the follow, but probably the least aesthetically pleasing. Online the image is broken into smaller pictures so you can zoom closer, but is also available as a large poster in PNG or PDF formats. The data for this one is from 2006, and is the most current of the three.
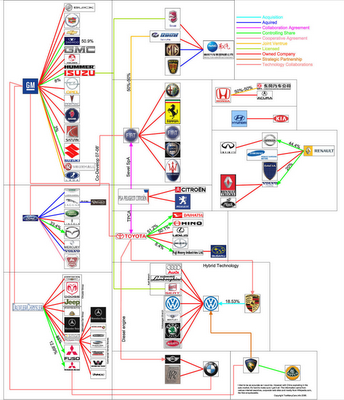

This last graphic claims to show the ownership mix in the auto industry as a form of bubble chart, but I can't find any date or source data link. I think the bubble sizes represent something, like size of the company or ownership, but I can't tell. So I can't tell how accurate this is. The image is on Tinypic.

Monday
Oct222007

Wikipedia Activity Visualization


From A Beautiful WWW, this image is a pretty good attempt to visualize the article revision activity on Wikipedia. An article explaining the visualization is here, but the image is a combination of images are from the most linked-to articles, and the size of the colored dots represent the amount of revision activity in the linked articles.

A really cool interactive version was made using the Google Maps API so you can zoom in and move around the graphic.

Friday
Oct192007

Infographic Music Video

A complete music video made of infographics! It’s pretty good too! The song is “Remind Me” by Royksopp, and the video continuously blends one infographic into the next. Let’s hope real life is more than a series of graphics about the choices we make.

Found on the Data Mining blog.

Friday
Oct192007

The Flu Virus


Flu season is coming soon, so its about time to know your enemy. Graphic of the Flu virus from newscientist.com.

Kinda looks like a big squishy ball doesn't it?

Thursday
Oct182007

Plastic Bags


Here's another one from Chris Jordan. Is it art, or is it infographic?

The image shows 60,000 plastic bags, which is how many bags are used in the U.S. every 5 seconds! The picture currently on display at the Paul Kopeikin Gallery in Los Angeles is 5ft x 6ft large so viewers can step up close to see all of the details.