About
Randy Krum
President of InfoNewt.
Data Visualization and Infographic Design

Infographic Design

Infographics Design | Presentations
Consulting | Data Visualizations

DFW DataViz Meetup

Join the DFW Data Visualization and Infographics Meetup Group if you're in the Dallas/Fort Worth area!

Search the Cool Infographics site

Custom Search

Subscriptions:


Feedburner

The Cool Infographics® Gallery:

How to add the
Cool Infographics button to your:

Cool Infographics iOS icon

- iPhone
- iPad
- iPod Touch


Read on Flipboard for iPad and iPhone

Featured in the Tech & Science category

Flipboard icon

Twitter Feed
From the Bookstore

Caffeine Poster

The Caffeine Poster infographic

Wednesday
Oct172007

Americans Remain Woefully Ill-Informed


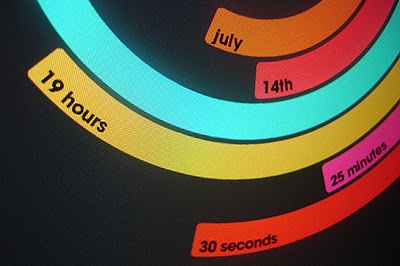
Wired magazine calls infographics like this "infoporn". I guess you could call this a version of a bubble chart, but it shows a comparison of what people knew in 1989 vs. 2007. Separately it shows knowledge of three questions based on the respondent's usual source of news.

I can't tell how big the sample size was, or what type of people they interviewed. It quotes the source as the Pew Research Center for the People & the Press, but that alone isn't enough to make it credible.

Monday
Oct152007

Potential Solar Energy


Submitted by a reader (thanks Louis), this infographic is from Good Magazine. Of course there isn't actually a way to capture ALL of the light from the sun, but it is indicative that we should be able to capture more than we do.

Check out this link at Good Magazine for a few other infographics too.

Sunday
Oct142007

Nip and Tuck


From Many Eyes, this bubble chart shows the number of plastic surgery procedures per 100 people, by nation. Let's just say, the U.S. is one of the smaller countries measured this way.

Friday
Oct122007

Radial Organization Chart

Found on Visual Complexity, this chart from 1924 is an interesting variation of an organization chart. With the authoritarian leader in the center, the subordinates are mapped outward from the center. Rings at different radii show peer level responsibility.

Tuesday
Oct092007

WiFi Detector T-Shirt

Another one for the "real world" infographics. This t-shirt from ThinkGeek will detect WiFi 802.11b or 802.11g wireless networks and display their signal strength on the front of the shirt. A great Christmas present for the geek in your family, for only $30.

It will amuse you, that I caught this one from Guy Kawasaki on Twitter.com, which linked to Truemors.com, which linked to BoingBoing.com, which linked to BoingBoingGadgets which finally linked to the original page on ThinkGeek.com. What a tangled web we weave...

Monday
Oct082007

Population Heat Map


From CraigStats, the image above shows the population per square mile in the San Francisco area as a pseudo heat map. The site also has combined the apartment listings on Craig's List with Google maps to create pseudo heat maps showing the areas with the most apartments.

Saturday
Oct062007

Flight Patterns


The images at Flight Patterns are really cool, but the videos are awesome (I think my favorite is the color coded)! Created by Aaron Koblin at UCLA, he took the daily flight data from the FAA and plotted the flight paths over the U.S. over time.

Found on Visual Complexity.

Thursday
Oct042007

Breathing Earth


Breathing Earth is a cool website that displays international statistics in real-time, similar in concept to Poodwaddle.com's World Counter. Breathing Earth focuses on carbon dioxide emissions by country and adds population, births and deaths.

Welcome to Breathing Earth. This presentation displays the carbon dioxide emission levels of every country in the world, as well as their birth and death rates - all in real-time. Though considerable effort has been taken to ensure that the presentation uses the most accurate and up-to-date data available, please remember that this is just a simulation.
Breathing Earth was created by David Bleja (aka Stillwater), whose home website is stillwater-microcosm.net

Found on SimpleComplexity.net

Tuesday
Oct022007

Who participates online?


A good one from BusinessWeek.com. This chart shows the participation in the various Web 2.0 activities by age group.

As part of Gen X, these graphs look like a tidal wave rising up behind me.

Monday
Oct012007

The Polar Clock


The Polar Clock, from Pixel Breaker, version 3 is now out as a screen saver for Mac and Windows. It's also available as a Mac OS X Widget.

I don't know why, but I love this clock. I'm mesmerized watching the seconds going around. With a little practice, you can visualize the time. I won't say this is the best way to visualize the time, but it's definitely fascinating.