About
Randy Krum
President of InfoNewt.
Data Visualization and Infographic Design

Infographic Design

Infographics Design | Presentations
Consulting | Data Visualizations

DFW DataViz Meetup

Join the DFW Data Visualization and Infographics Meetup Group if you're in the Dallas/Fort Worth area!

Search the Cool Infographics site

Custom Search

Subscriptions:


Feedburner

The Cool Infographics® Gallery:

How to add the
Cool Infographics button to your:

Cool Infographics iOS icon

- iPhone
- iPad
- iPod Touch


Read on Flipboard for iPad and iPhone

Featured in the Tech & Science category

Flipboard icon

Twitter Feed
From the Bookstore

Caffeine Poster

The Caffeine Poster infographic

Tuesday
Aug212018

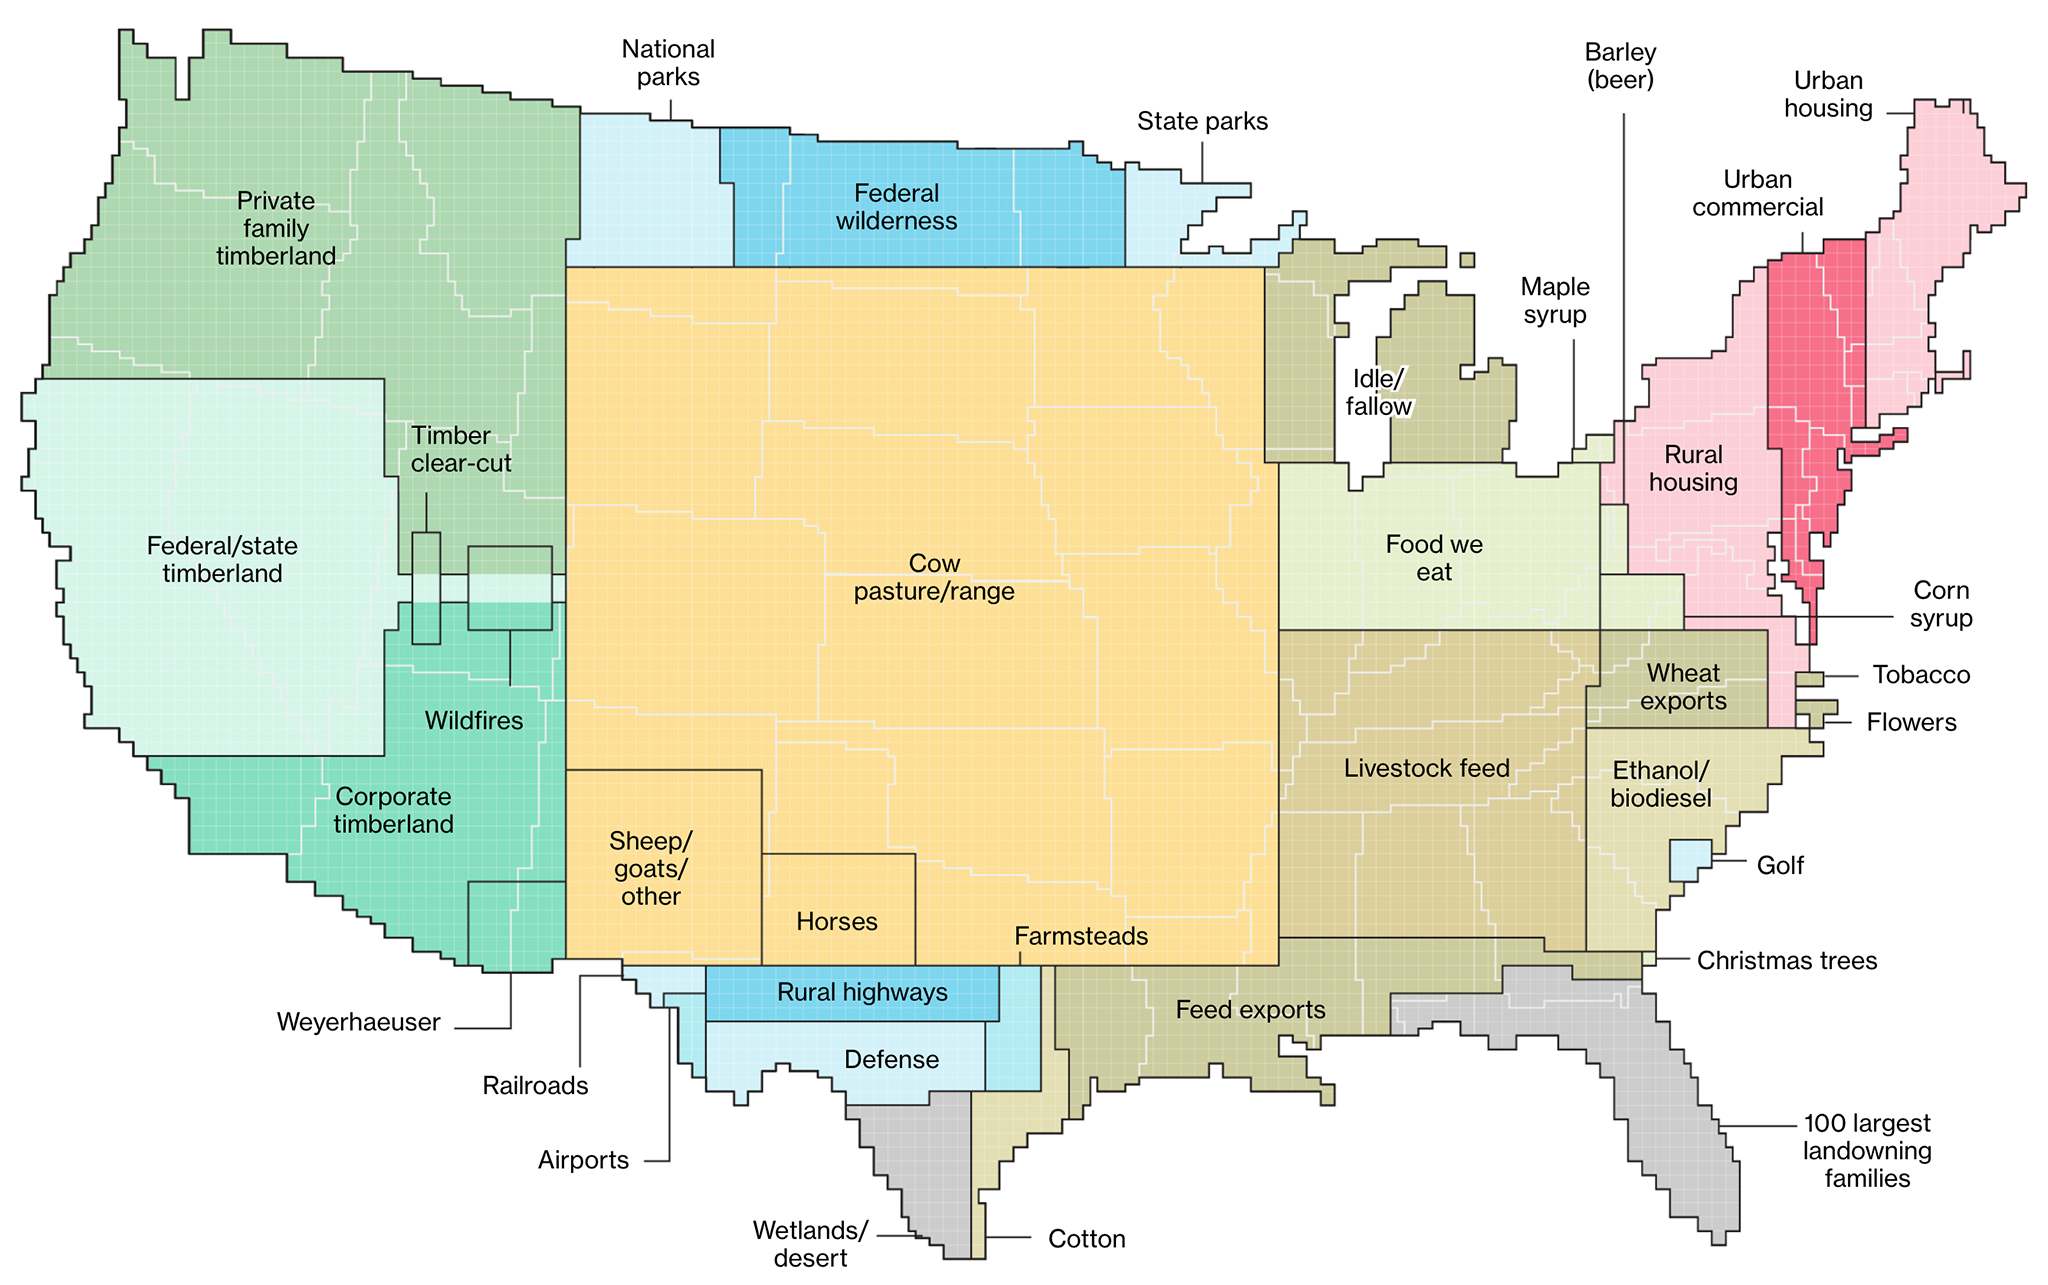
How America Uses its Land

Here's How America Uses its Land infographic

America's land use is very diverse and scattered throughout the states. By using surveys, satellite images and categorizations the U.S. Department of Agriculture divides the U.S. into six major types of land. Bloomberg took that data, and created the How America Uses its Land infographics. The infographics use the map to show both how much of the country is made up of a certain land use, and where the majority of it is located.

Using surveys, satellite images and categorizations from various government agencies, the U.S. Department of Agriculture divides the U.S. into six major types of land. The data can’t be pinpointed to a city block—each square on the map represents 250,000 acres of land. But piecing the data together state-by-state can give a general sense of how U.S. land is used.

Gathered together, cropland would take up more than a fifth of the 48 contiguous states. Pasture and rangeland would cover most of the Western U.S., and all of the country’s cities and towns would fit neatly in the Northeast.


Found on https://5wvelascoblog.com

Friday
Aug102018

Giveaway: 5W Information Graphics & Data Visualization Workshop Dallas

This month (August 2018) I'm giving away ONE FREE ticket to attend the 5W Information Graphics and Data Visualization 2-day workshop in Dallas, TX on September 13-14, 2018.

Register on the Giveaways Page by August 31, 2018 to be entered, and the winner will be chosen on September 1st!

Juan and Samuel Velasco currently have workshops scheduled in four cities across the U.S., so I'm jumping on the chance to attend and help promote the workshop in Dallas. I highly recommend you check out the schedule and attend one if they are close to you.

Monday
Aug062018

An Introduction to Hydroponics

An Introduction to Hydroponics infographic

Hydroponics is a method of growing plants without soils. An Introduction to Hydroponics infographic goes over the benefits of using the technique, and a couple of different methods you could use. It is a great visual explanation of each setup and could really come in handy for any newbies interested in the field. Just make sure you read the section on what plants are best for hydroponics! You can find the full details at Green and Vibrant

Hydroponics is a dirt-free, space-saving, water-effective method of growing soilless.

This practice is not new. In fact, the earliest records of Hydroponics dated back to the ancient civilizations. And modern Hydroponics has been used widely in the commercial greenhouses as well as at home for over 30 years.

If you're just getting started with Hydroponics, or you're looking to hone and your knowledge and skills.

You come to the right place.

In this guide, you'll learn about the most important details about Hydroponics and all the basic knowledge to set up a year-round hydroponic garden of your own.

Read more at https://www.greenandvibrant.com


Found on Green and Vibrant

Friday
Jul202018

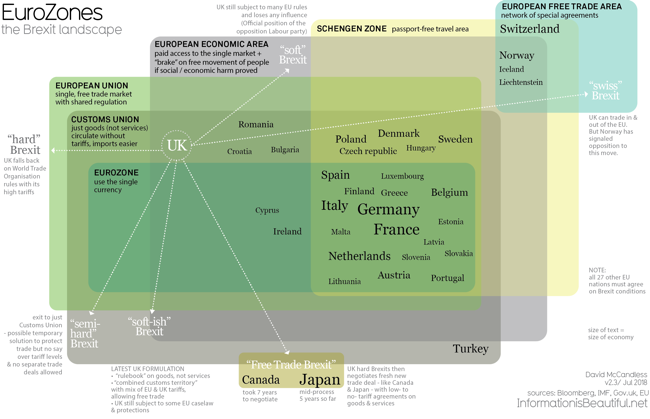
The UK's Brexit Options in the EuroZone Visualized

The team at Information Is Beautiful have visualized the different options available to the UK in EuroZones: The Brexit Landscape, and have been making updates as the situation evolves.

Brexit? The Eurozone? The European Economic Area? The European Free-Trade Area? The European Customs Union? Whaaat?

A graphic that hopefully clarifies the complex structure of the European Union and the UK’s various routes and options for Brexit.

UPDATE: 15th July 2018: The saga continues. The UK announces its ideas for a “common rulebook” and “facilitated customs arrangement”, effectively a ‘soft’ Brexit.
Hard Brexit ministers resign.

UPDATE 3rd July 2017: It’s getting complicated! Added 2 more Brexit routes. See the first version.
UPDATE 1st AUG 2017: Detailed UK opposition party Labour’s positions. Refined ‘Free Trade Brexit’ & typical negotiation times (from here). Clarified a key difference between EEA (good & services) & Customs Unions (just goods). Read a useful, clarifying article
UPDATE 28th AUG 2017: UK opposition party, Labour, has now consolidated under a “soft Brexit” position.


Thursday
Jul192018

Interactive Infographic From Coca-Cola Spain

Coca-Cola Spain is using the tool ThingLink to add animation and interactivity to their marketing infographics. ThingLink allows you to create "hotspots" that pop-up additional images, text and even videos.
Description: Coca-Cola Spain masters the art of digital storytelling by using interactive infographics on their blog.  In addition to it's attractive design, this infographic captures viewer attention with the use of motion (via GIFs).  In the infographic below, Coca-Cola shares how they have driven employment and progress in Spain since 1953. 

Monday
Jul022018

What Your Font Says About You

What Your Font Choices Say About You infographic

What Your Font Choices Say About You infographic from GetVoip is a comical explanation of why we choose what font we use.

In 1975, two Swiss designers, Max Miedinger and Eduard Hoffmann came out with the font Helvetica. Since then, it has been used on some of the biggest brands in the world, such as Verizon, 3M, Kawasaki, Jeep, Tupperware, Target, Panasonic, and Apple.

What is it that makes this font and others so alluring?

For most of us, unless you are a designer in some capacity, the font choice on reading materials is overlooked or completely ignored. But there may be something that still triggers in the subconscious that helps you recognize a good font. In one study at MIT, subjects were found to be in a better mood after reading something with “good” typography. The subjects also saw improved performance in certain cognitive tasks after reading the “good” typography instead of the bad.

Today, there are over 33,000 fonts available on sites like MyFonts.com With so many choices, and so much at stake, how do you know which to choose? And furthermore, when choosing a font, do you know what message it might be conveying to your readers?

We put together an infographic below that looked at some of the most popular fonts of the day and provided some feedback on what message you might be sending with that font choice or style.

Whether you are drafting an important email or deciding on a font to use for your brand, you will certainly want to know how this decision will come to define you. We all have likely experienced either sending or receiving an embarrassing misspelling, grammatical error, or autocorrect failure, but choosing the wrong font can become the biggest mistake of all.

If you have ever been concerned about how you will be perceived by your choice of font, your concerns are warranted. Dan Gilbert, the majority owner of the Cleveland Cavaliers basketball team, received a maelstrom of criticism after his open letter regarding Lebron James’ move to the Miami Heat was written in the Comic Sans font.

When choosing your font it’s best to default to a standard serif or sans-serif versus a more decorative or script font, even if you are resentful that your elementary school teacher said that you would need to know cursive in life––lies!

What does using Trebuchet on the Cool Infographics site say about me? 

Thank you to Drew for sending in the link!
Thursday
Jun142018

Giveaway: Design Better Charts in PowerPoint

The giveaway for June is ONE FREE PASS to my complete class on Skillshare, 44 minutes for all 10 lessons! Students with a Free Access Link can watch the complete class for free without a Skillshare Premium Membership.

Register on the Giveaways Page by June 30, 2018 to be entered.

Skillshare is an online subscription learning community with thousands of classes on everything from business to graphic design to fashion – it’s the Netflix of learning. You can use THIS LINK to see my class and sign up and get two free months! That's plenty of time to take my class and try out a few others. Once you're a member, you have access to all of classes that Skillshare offers, and there are thousands of them.

If you're already a Skillshare member, then you already have access! Please check out my class, and share with your network of friends and co-workers. Follow me on Skillshare to catch any future class I post as well!

Here's a quick time lapse of the sample file I use for demonstration in the class. This will give you an idea of how the data visualization design principles are applied to a bar chart in PowerPoint:

Monday
Jun042018

The Family Banners of Westeros

The Family Banners of Westerns infographic

The Family Banners of Westeros infographic from UK Feather Flags describes the meaning behind the designs on the flags from the popular HBO television show Game of Thrones.

Here is an excellent infographic that we have designed which takes a look at the meanings of the family banners of Westeros from the amazing television show called Game of Thrones. Learn all about the House Lannister banner, the House Stark banner, the House Targaryen banner and more by checking out this piece.

Thanks to Dave for sending in the infographic!

Friday
May252018

Digital Photography 101

Digital Photography 101 infographic

The Digital Photography 101 infographic from The Backdrop Store is a great primer for newcomers to the basics of photography.

This is a great use of an infographic as a high level summary that invites people to your website and to their much more detailed Digital Photography 101: The Definitive Guide for 2018

I usually advise against full color photos in infographics because they are visually noisy, and multiple photographs add multiple color palettes to one infographic design. However, in this case the topic is specifically about photography, so the use of photos is very relevant and appropriate. Notice the simple color scheme of the rest of the infographic so the photos can stand out and don't compete against the basic design.

Wednesday
May232018

The Real Cost of Unproductive Meetings

The Real Cost of Unproductive Meetings infographic

Meetings are important to a companies success no matter what the size; however, unproductive meetings can be extremely costly. STL produced The Real Cost of Unproductive Meetings infographic as a guide to help put on the most effient meeting possible to avoid a large financial impact.

They're not only far-too-frequently used and often a little bit dull, but those corporate meetings could be costing your business thousands (or even millions) every year.

A study by Bain & Company back in 2014 found that 15% of a businesses' time is spent on meetings, and that number has been increasing steadily for many years. Given the value we place on this time, how much of it is actually productive

For our latest infographic, we decided to take a look at the true cost of meetings, and present a formula for the perfect meeting - so, if you simply must hold one, at least you can make sure it's as productive and cost effective as possible.

Overall, a good infographic with some good data and information.

However, I take issue with how some of the data is visualized. In the Financial Impact section, vertical bars are shown to represent the cost of meetings. These bars don't accurately represent the values being shown with the $12 bar half the height of the $527 bar. Either the design just eye-balled the size of the bars, or this is a non-zero baseline bar chart that starts somewhere around $300. This is cvisually misleading to the audience, especially when the scale isn't shown.

The footer infomation is missing both a Copyright (or Creative Commons) license and the URL to either the company or the infographic landing page is missing. How are readers suppsed to find the original post?

Thanks to Dave for sending in the link!