About
Randy Krum
President of InfoNewt.
Data Visualization and Infographic Design

Infographic Design

Infographics Design | Presentations
Consulting | Data Visualizations

DFW DataViz Meetup

Join the DFW Data Visualization and Infographics Meetup Group if you're in the Dallas/Fort Worth area!

Search the Cool Infographics site

Custom Search

Subscriptions:


Feedburner

The Cool Infographics® Gallery:

How to add the
Cool Infographics button to your:

Cool Infographics iOS icon

- iPhone
- iPad
- iPod Touch


Read on Flipboard for iPad and iPhone

Featured in the Tech & Science category

Flipboard icon

Twitter Feed
From the Bookstore

Caffeine Poster

The Caffeine Poster infographic

Entries in history (262)

Friday
Oct262012

A Visual History of the US House poster and interview

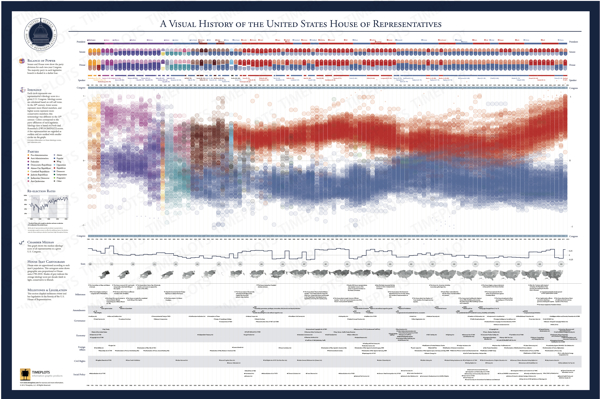
The Visual History of the United States House of Representatives infographic poster


Timeplots has launched a new infographic poster, The Visual History of the United States House of Representatives.  Available for purchase from the Timeplots site for $34.95.

This large-scale (48″x32”) print is like nothing else available on the history of the U.S. House of Representatives. It depicts the progression in political ideology of every House seat from 1789 to 2010.

Other highlights include a timeline of over 100 major legislative enactments and significant developments in U.S. legislative history, and visual summaries of party control and ideological distribution of the House and Senate in each Congress. A Visual History of the U.S. House of Representatives is packed with information and is not intended to be absorbed at a glance, but rather visited and revisited over time. 

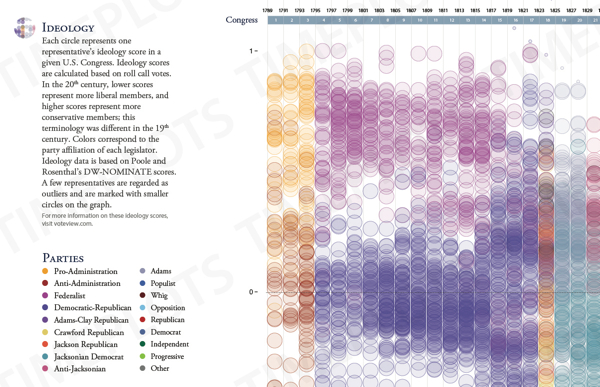
The infographic design visualizes the entire history from 1789-2013.  The main, central visualization is the unique highlight of this design.  Each representative is shown by a colored circle that matches their party affiliation, and placed along a vertical scale based on their ideology.  The circles are filled partially transparent, so you get the cumulative color effect when the circles overlap.  This creates a darker color when many representatives within any particular two-year Congress share a similar ideology, and you can see clear areas of concentration.  Fantastic new visualization method, and creates a beautiful image.

The Visual History of the United States House of Representatives infographic poster ideology

The poster also visualizes the balance of power for each two-year Congress by party, and compares it to the Senate and the President from the same time period.  Major milestones, amendments, governance issues, economy, foreign affairs, civil rights and social policy achievements are also plotted within the time periods they took place.

Nathaniel Pearlman, Founder and President of Timeplots, agreed to answer a few behind-the-scenes questions about designing the poster.

Cool Infographics: What software applications were used to help analyze the data and create the design?

Nathaniel Pearlman: So far we have programmed our information graphic prints in the R language and done the final design pass in Illustrator. I’m interested in hearing about other platforms to use for complex data and layout — especially other software applications that would allow us to create interactive and print versions from the same code base.

Cool Infographics: What’s the most interesting thing you learned from the data?

Nathaniel Pearlman: As with some of our other posters, I like the big picture: for me, the visual history of the U.S. house print shows the sweep of U.S. history — a marked contrast with the more journalistic, and immediate, take on the political and economic state of the nation that we are used to seeing in the news. You can clearly see the ebb and flow over time of ideological overlap between the parties – and how they are at such loggerheads now.

Cool Infographics: What was the hardest part behind designing the House poster?

Nathaniel Pearlman: For the House poster, it took us a while to come up with a compelling central graphic. We were looking for something visually arresting from a distance, but that captured the key patterns in the data.  I think we found that.  

Cool Infographics: What should we expect in the future from Timeplots?

Nathaniel Pearlman:  We have recently launched Graphicacy, a design group that helps other tell their own stories with print or interactive information graphics, especially involving large or complex data sets. For Timeplots, we are currently working on a history of U.S. State boundaries and a visual history of baseball. I am excited about both of them. I would also love to hear from your audience what they would like to see, and we are always looking for collaborators, if someone would like to work with us on a project that they care about. We’re open to new ideas!

Cool Infographics: Who is your primary audience for the posters?  Schools, businesses, political offices, individuals, etc.?

Nathaniel Pearlman: Our primary audience is those with true interest in the subject matter.  Our work is explanatory or educational art for smart people – and just about everyone has areas of intense interest, whether it is sports, entertainment, food, politics or finance.  Timeplots has done a lot with American politics so far, but we intend to move now into other areas as well.


Monday
Oct152012

The History of Film infographic poster

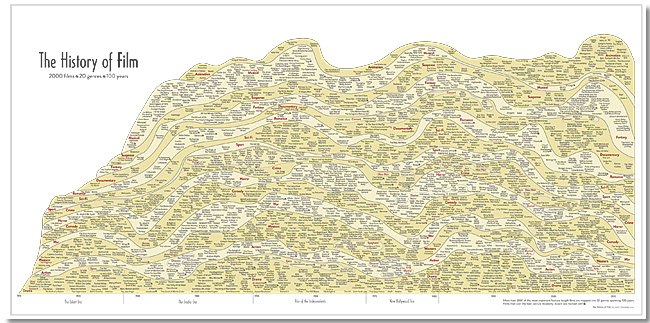
The History of Film infographic poster

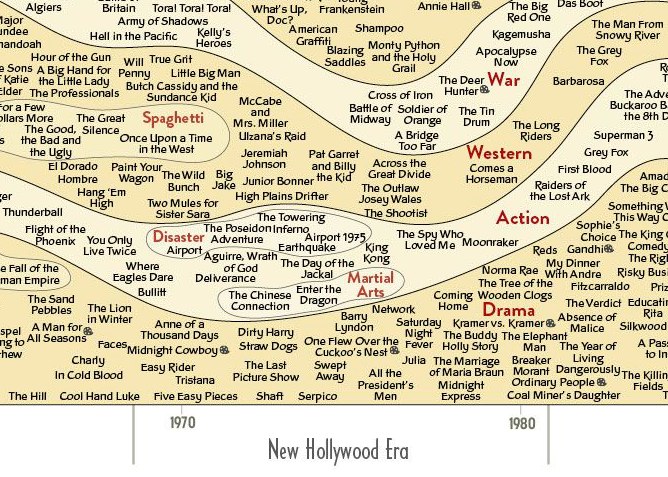
New infographic poster by Larry Gormley from HistoryShots.  The History of Film plots out the most important films of the last 100 years into a beautiful, flowing timeline that visually separates the films by 20 different genres.

This graphic chronicles the history of feature films from the origins in the 1910s until the present day. More than 2000 of the most important feature-length films are mapped into 20 genres spanning 100 years. Films selected to be included have: won important awards such as the best picture Academy Award; achieved critical acclaim according to recognized film critics; are considered to be key genre films by experts; and/or attained box office success.

The History of Film infographic poster

You can buy the 43” x 23” inch poster for $34.00 and definitely check out the zooming viewer to see the poster up close at Historyshots.com.

Great job Larry!

Tuesday
Oct092012

Hurricanes Since 1851

Hurricanes Since 1851 infographic

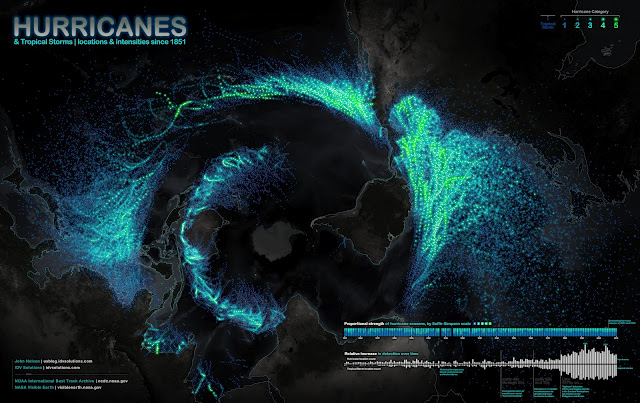
Science meets art in the Hurricanes Since 1851 infographic from John Nelson, IDV Solutions, on UXBlog. The infographic maps out storm paths and wind speeds of hurricanes since 1851.  The photo is the projection view of the globe from the south pole perspective.

Ok, here’s a bottoms-up view of known tropical storms and hurricanes dating back to 1851.  The fine folks at NOAA keep an archive of storm paths with wind speed, storm name, date, among other attributes, and are always updating and refining information for past events based on historical evidence and educated hunches.  The data are awesome and they make it available in several formats.  Here’s what it looks like slapped onto a polar projection (looking up at Antarctica) with point color tied to intensity

A couple of things stood out to me about this data…

1) Structure.
Hurricanes clearly abhor the equator and fling themselves away from the warm waters of their birth as quickly as they can.  Paging Dr. Freud.
The void circling the image is the equator.  Hurricanes can never ever cross it.

2) Detection.
Detection has skyrocketed since satellite technology but mostly since we started logging storms in the eastern hemisphere.  Also the proportionality of storm severity looks to be getting more consistent year to year with the benefit of more data.

Data visualization design reveals patterns and makes data understandable, and this is a huge, effective data visualization.

Thanks to Renee for sending in the link!

Friday
Oct052012

The Supernatural Sprawl of True Blood

the supernatural sprawl of true blood infographic

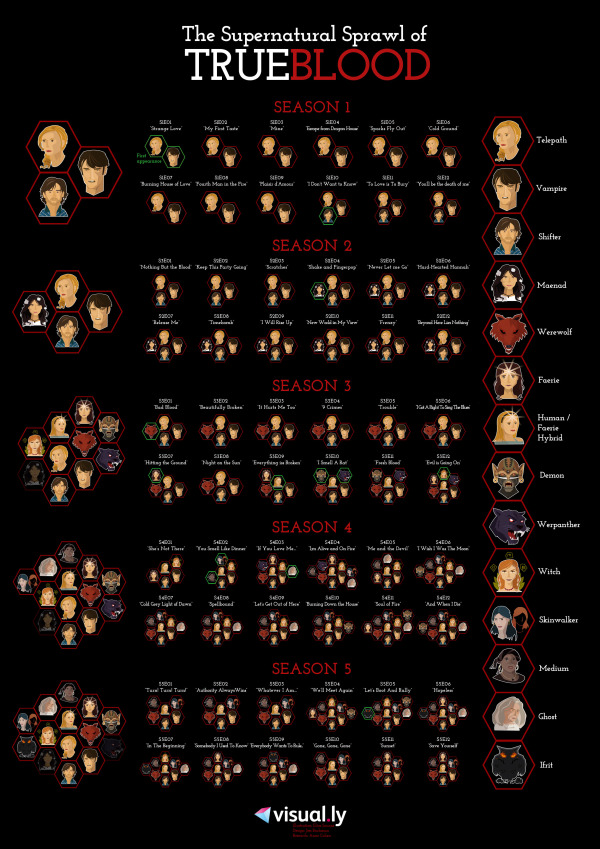
The HBO phenomenon that captured our attention it’s first season has become hard to follow. The Supernatural Sprawl of True Blood infographic created by Jess Bachman from visual.ly breaks down the types of characters that have appeared so far in each season and each episode.

TrueBlood started as a show about the relationship between humans and vampires. But over the course of five seasons, the list of supernatural creatures has been steadily expanding. Love it or hate it, there are a lot of supes — and keeping track of them all is becoming increasingly complex. This infographic should help you sort it all out.

The design does a good job of using unique, recognizable illustrations for each type of creature, and then grouping them together for each episode.  It’s also very obvious that the episodes have consistently gotten more complicated as the show progressed.

Credit for the illustrations goes to Ilias Sounas, and thanks to Jess for sending in the link!

Monday
Oct012012

Honda Accord: 30 Years of U.S. Production

Honda Accord 30 Years of American Craftmanship infographic

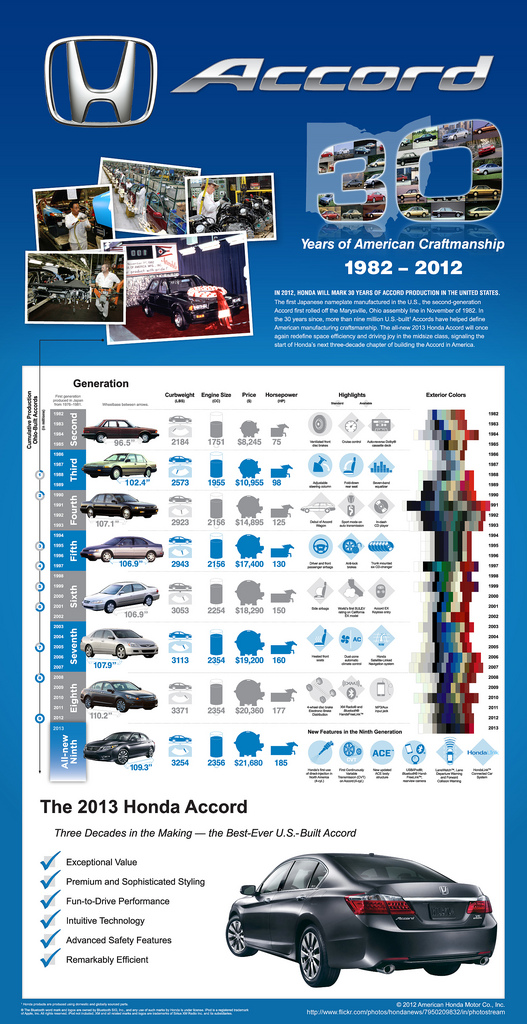
Honda Accord: 30 Years of American Craftmanship is a large infographic from Honda America that was released as part of the release of the new 2013 model design of the Honda Accord in August.  Designed by Jeremy Yingling with InfoNewt (my company) this is a very brand specific, marketing-style infographic.

IN 2012, HONDA WILL MARK 30 YEARS OF ACCORD PRODUCTION IN THE UNITED STATES.

The first Japanese nameplate manufactured in the U.S., the second-generation Accord first rolled off the Marysville, Ohio assembly line in November of 1982. In the 30 years since, more than nine million U.S.-built1 Accords have helped define American manufacturing craftsmanship. The all-new 2013 Honda Accord will once again redefine space efficiency and driving joy in the midsize class, signaling the start of Honda’s next three-decade chapter of building the Accord in America. 

The 2013 model becomes the ninth major design generation of the Accord.  This gave us the opportunity to highlight differences each major model design has brought to the Accord over the last 30 years.  The design visualizes the major technical specifications, the major advancements included in the Accord and shows the multi-year periods that each design generation was available.  The eye-catching color-waterfall shows the available exterior colors available for every model year, and the milestones along the left-side of the design show the progression to reach a cumulative total over 9 million Accords produced in 2012 coming out of the manufacturing plant in Marysville, OH.

Honda has done a great job of utilizing this one infographic design in a handful of different ways.  The infographic was initially used as 9’ banners at the Honda press events, and included in the press kits provided to everyone invited to attend.  Honda has now released the infographic online on the Honda News page on Flickr, making the design available to everyone.

Friday
Sep282012

The History of Mickey Mouse

The History of Mickey Mouse infographic

Mickey Mouse hasn’t just survived for 80 years, he has thrived. The History of Mickey Mouse infographic from Goin2Travel.com has condensed this famous mouse life style into a highlight timeline.

Mickey Mouse is the most recognizable Disney character on the planet. After more than 80 years of stardom, we thought it would be fun to review the history of this iconic mouse. From humble beginnings during the “roaring twenties”, surviving and even flourishing during the “great depression” right up to the digital age present, he and his fellow, Disney stars, are favorites of children everywhere.

So whether your planning a visit to Disney World Orlando, or just a fan,  sit back, relax, and enjoy this visual history trip through time of Mickey Mouse.

They did a good job of showing the reader actual images and photos of Mickey through the years, and I like the use of Mickey Hands as the arrowheads on the connecting lines.  

The biggest issue is that many of the images are so far away from the correct year along the righthand side, that it’s very hard to follow the connecting lines.  You really don’t want images from the 1950s visually placed next to 1970s on the timeline.  I would suggest putting the years down the middle and placing the event images on both sides so they can be adjacent to the actual time on the timeline.

The URL at the bottom should be a link to the original infographic instead of the frontpage of the company site.  You want readers to be able to find the original infographic when it’s not correctly linked on the Web.

Friday
Sep072012

Visual History of Cooper Black

Visual HIstory of Cooper Black infographic

Where’s Waldo?  More like where’s Cooper Black?  The font is everywhere! The Visual History of Cooper Black infographic was created by fibers.com to show their love for Cooper Black.

You might not know it, but you’ve seen Cooper Black. On the shop-front, in naughty magazines, album covers and candy wrappers - this depression era novelty font gets around. And why wouldn’t it, it’s curvaceous and friendly, as the type designer who created this font said, “It’s a typeface for farsighted printers with nearsighted customers.

We think Cooper Black is just lovely, with a rich and robust history - so we put that history down visually with this infographic. 

What a great topic and design!  This topic just screams for the design to show the reader actual examples of Cooper Black in action, and the use of images in the timeline does just that.  The design is focused on telling just one story, the timeline, and is fun & easy to read.

Thanks to Alia for sending in the link!

Monday
Aug272012

The Visual History of Swimwear

The History of Swimwear Swimsuits infographic by Backyard Ocean

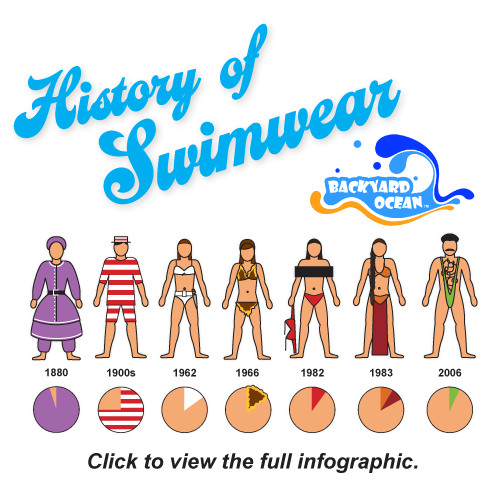
The History of Swimwear infographic is a visual timeline from Backyard Ocean that shows the evolution of the swimsuit over the last 150 years.

The swimsuit: a symbol of stylish summer fun. Parade it on the beach or in the privacy of your above ground pool at home. Swimwear’s history has grown from cavemen furs to science fiction fancies. Artsy, classy, conservative or sexy, the swimsuit is an icon of summer style and fashion. Backyard Ocean takes a breath from swimming to see just how the swimsuit has changed through time. CLICK on the image to enlarge!

The History of Swimwear Swimsuits infographic by Backyard Ocean

This is a design by Jeremy Yingling with InfoNewt (my company).  Each model on the timeline has an illustration showing off the fashions, and represents either a new suit design or a famous example from TV & movies.  My favorite part is the associated pie chart visualizing the amount of skin coverage for each swimsuit (or lack thereof).

The design also plots the amount of skin coverage over time, the evolution of the “thong” and how skin exposure does not automatically equate to higher sex appeal.

Thanks to the team at Backyard Ocean! 

Thursday
Aug092012

The Greatest Human and Digital Viruses of All Time

 The Greatest Human and Digital Viruses of All Time infographic

Viruses. We all hate them. If they aren’t slowings us down physically, they are slowing down our computers. See the best of the worst on uniblue’s The Greatest Viruses of All Time infographic from Uniblue’s free resource libraries site liutilities.com.

“If you think you are too small to make a difference, try sleeping with a mosquito.” ― Dalai Lama XIV

Viruses are inevitably small in nature, yet engineered to unleash intense and often terrifying devastation. They leave a costly aftermath whether it’s the irreparable loss of human life, or millions (sometimes billions) of dollars in lost revenue and property.

We have gone through history to find the worst viruses of them all; little creatures and scripts that have taken advantage of social and economic situations to propagate and amplify their prowess in mayhem and destruction.

Join us in this brief journey through time, spanning back as early as 1348 where we shall meet the darkest and most wicked viruses to ever afflict mankind.

This is a really elegant design that does a fantastic job of telling a story and walking the reader through the information.

Mostly text and illustrations, there aren’t many numerical data point to visualize.  The few numbers there are to work with, could have been visualized better to give them context and help the readers understand them better.  Why are 21 human icons shown to represent “75,000,000 to 200,000,000 dead” from the Black Death plague?

At the bottom should be some type of copyright (or Creative Commons) statement, and the URL for readers to find the original infographic landing page.

Designed by Derek Fenech, thanks for sending in the link!

Friday
Aug032012

Celebrating their First $1,000,000 of Custom Made Products

Celebrating their First $1,000,000 of Custom Made Products infographic

In its first six months CustomMade.com made their first million of custom products! They take their clients ideas and match them with professionals to get the job done.  Their Celebrating Our First $1,000,000 of Custom Made Products infographic shows their process and success. 

Over the first six months of 2012, we here at CustomMade have been thrilled to witness the growth of the first entirely custom online marketplace.  Our team has been constantly working to improve the site experience and our ability to match customer’s idea’s with the talented professional makers who can bring them to life.  Recently we paused for a moment and realized we were about to pass an important milestone for our marketplace – $1,000,000 worth of custom made products!

Along the way we’ve seen some amazing custom creations ranging from $32,000 custom kitchen cabinets to an $11 hand carved wooden pendant. We’ve seen rings made out of vinyl records, rings with amazing details from a family crest, and even an engagement ring in the shape of R2D2 (which any Star Wars fan would love).  Our makers have brought to life a children’s bed in the shape of a slipper, amazing custom humidors, and even a custom cat bunk bed!  You can browse all of our projects in progress on the site, or browse over 35,000 completed projects.

This work is being done by over 2,000 professional makers across the U.S. and Canada.  They include furniture makers, jewelers, ceramicists, glass blowers, metal workers, leather tanners, and much more.  These makers represent that true craftsmanship still exists today and that consumers are able to not just purchase an item off the shelf, but to create an heirloom that can be cherished for years to come.  We are proud to support these local makers and the products they create, and are looking forward to seeing what unique items they make next!

I love the classic, clothes-tailor style that dominates the overall design.

My biggest complaint with this design is the lack of data visualizations.  Big fonts are NOT data visualizations.  Visualization put the values into context for the reader by comparing them to another value so the reader can understand if a number really is big or small.

I love that the infographic itself was “Crafted by hand”, but in the spirit of the business, they should have given the designer credit by name.

Thanks to Zach for sending in the link!