About
Randy Krum
President of InfoNewt.
Data Visualization and Infographic Design

Infographic Design

Infographics Design | Presentations
Consulting | Data Visualizations

DFW DataViz Meetup

Join the DFW Data Visualization and Infographics Meetup Group if you're in the Dallas/Fort Worth area!

Search the Cool Infographics site

Custom Search

Subscriptions:


Feedburner

The Cool Infographics® Gallery:

How to add the
Cool Infographics button to your:

Cool Infographics iOS icon

- iPhone
- iPad
- iPod Touch


Read on Flipboard for iPad and iPhone

Featured in the Tech & Science category

Flipboard icon

Twitter Feed
From the Bookstore

Caffeine Poster

The Caffeine Poster infographic

Entries in InfoNewt (32)

Tuesday
Apr242012

Gov 2.0 Infographic: Bringing the Tobacco Control Act to Life


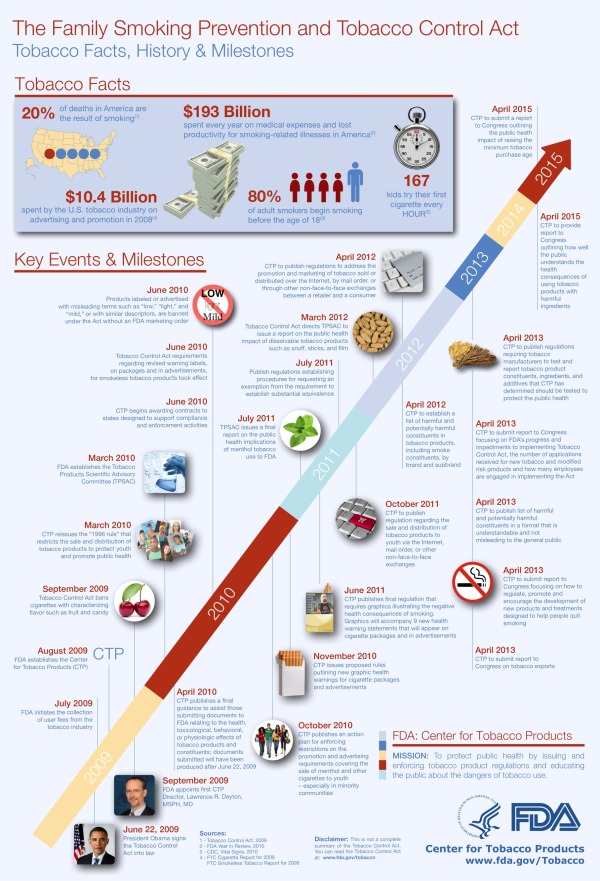
In 2011, Enspektos, a health marketing communications innovation consultancy, invited InfoNewt (my company) to be involved in a special project the firm was leading on behalf of the Food and Drug Administration’s (FDA) Center for Tobacco Products (CTP).  As a new federal agency, the CTP is tasked with regulating tobacco products and preventing tobacco use – especially among youth.

During the project, we collaborated with the CTP to help create The Family Smoking Prevention and Tobacco Control Act: Facts, History and Milestones, an infographic timeline that covers the past and future actions related to the Tobacco Control Act passed in 2009.

The Family Smoking Prevention and Tobacco Control Act (Tobacco Control Act) is an important piece of legislation with many requirements. This infographic illustrates the history, rationale and major events associated with the Act. The Tobacco Control Act provides all of the events, deadlines and requirements in full and should be used as the final resource for information about the Act.

The infographic is yet another example of Gov 2.0, or the effort to utilize a range of digital technologies to improve government transparency and public understanding of how federal agencies function.  The original Tobacco Control Act is a 68-page document available online, but in actual practice that isn’t easily accessible or understandable by the general public.  The FDA has created several tools to help the public understand the Tobacco Control Act, like a snapshot overview of the Act, an interactive scrolling timeline viewer, a searchable interface and the infographic timeline.

On Wednesday, April 25th, the FDA is holding a LIVE webinar to share the different tools they have created to help everyone access and understand specific information from the 68-page law. 

Attend Our Live Webinar!

As you might expect from an official government publication, the design went through many iterations of review and revisions.  In my opinion, the final infographic is text-heavy, but strikes a balance between optimal design and content that was vetted and approved by many different individuals at the CTP. 

Fard Johnmar, Founder and President of Enspektos agreed to answer some questions about the project.

Cool Infographics: How do you think the infographic and other tools will aid public understanding of the Tobacco Control Act and the CTP? 

Fard Johnmar:  I think the infographic and other tools are an important step for the federal government.  Transforming dense and complicated legislation into simple, visually appealing information products is a very difficult process.  You have to balance the wish to make things clear and concise with a requirement that information be as accurate and complete as possible.  

We had two primary goals: The first was to improve the public’s understanding of the Tobacco Control Act.  The second was to get people within FDA comfortable with using new tools that help visually communicate important regulatory and public health information.  Now that this project is complete, I think FDA will be looking for other ways to communicate about its mission and activities in more visually appealing ways.

Cool Infographics: Do you see other health and medical organizations using visual communications techniques? 

Fard Johnmar: Absolutely.  In fact, since we published the Empowered E-Patient infographic a few years ago, I’ve seen a number of health organizations using infographics to communicate about a range of topics, including GE for its Healthymagination project (click here for a few sample infographics).

Cool Infographics:  How difficult was it to push the infographic through the FDA approval process

Fard Johnmar: As you can imagine, getting final approval for a novel visual project like this can be difficult for large organizations.  However, there was a real passion for the project from Sanjay Koyani, Senior Communications Advisor at the CTP and other members of his team.  They helped to successfully meet all of the legal requirements and answer the numerous questions posed by colleagues at the CTP.  Now there is a higher comfort level at the agency with utilizing these types of visual tools to tell the CTP story.

I truly appreciated being involved in the project, and think this is a really big step towards making the often overly complex information released through official government channels more understandable to more people.

Thanks to Enspektos and the team at the Center for Tobacco Products!

Wednesday
Mar282012

Client Infographic: The Mobile Advantage

Nuance Communications has released a new infographic, The Mobile Advantage, sharing the results of their own mobile consumer preference research.  Designed by InfoNewt, this infographic design tells the story of how important mobile apps are to brands.

If you’re a consumer-facing organization hoping to use mobile to build a strong, long-lasting relationship with your customers, there’s some good news!  A new survey shows that smartphone owners are increasingly downloading not just games but customer service apps - especially from their mobile carrier, bank and favorite retailers. In fact, 84% of consumers surveyed generally prefer to use a company’s mobile app for routine inquiries (checking balance, check flight status, etc.) rather than calling the company on the phone. 

As a B2B communication tool, this infographic does a great job sharing the key findings from the research statistics.  Since Nuance performed the research behind how apps form positive customer service experiences for customers, the infographic is a good tool to share that unique knowledge with their customers.

Broken into a three-part story, the design starts with some basic information about the growth of mobile devices.  The center section focuses on the huge impact on the customers’ view of a company when they have a customer service app.  And finally, the last section explores what customers would like to see in a customer service app.

Thanks to the team at Nuance for being outstanding to work with!

Friday
Mar162012

Client Infographic: Streamlining your Digital Life with the new iPad

With the Apple event last week announcing the release of the new iPad, the Streamlining your Digital Life with the new iPad infographic from NextWorth takes a look at the history of the electronic devices that the iPad has replaced in our lives.  A true multifunctional device, the iPad has replaced many of our separate gadgets.

The digital world is converging on a revolutionary all-in-one device, the powerful, brand-new iPad. These are the iconic portable devices that led to (and are to some extent being replaced by) Apple’s innovation.

The lines are color coded to connect the types of devices in the timeline, and show any devices that had multiple functions of their own (like the Eee PC 701).  Using a treemap in the iPad image, it also shows the amount of time spent using the different functions on the iPad from average consumers.  The use of illustrations instead of photographs of all these devices keeps the design simple and focused on communicating the data.

Finally, using their own internal data, an assortment of prices are shown of the current maximum values that consumers can get by trading in their now-obsolete gadgets.  With a handful of the right gadgets, you could easily get enough money back to pay for a brand new iPad!

All of the essential information is included in the design: data sources, brand logo, URL of the original high-resolution infographic landing page, company logo, copyright statement and even a mention of the designer (nice job Jeremy!).

This was an infographic design from my own company, InfoNewt, and of course, the team at NextWorth was fantastic to work with!

Wednesday
Feb082012

Client Infographic: Hotels.com Romance Survey


Hotels.com has released two Romance Survey infographics that share their own research behind romance and Valentine’s Day.  Designed by InfoNewt with designer Jeremy Yingling, the two versions cover research data both the U.S. and Canada.

Pack your bags, Sweetie Pie, we’re going on a romantic getaway!  We surveyed guys and gals of different ages who shared their secret dreams about the perfect romantic weekend.  Here’s how our lovebirds responded.

It’s fun, timely information that has a long Online Lifespan (won’t change over time), so the infographics will be relevant for years.  There was a lot of survey data, and I really like how the final result mixes up different ways to look at the aggregate data by also using the available demographics to show findings by age and gender.

I was impressed with the chivalry shown by 58% of men (both in the U.S. and Canada) that feel they need to plan and pay for a romantic Valentine’s date.


Thanks to the Hotels.com team for being great to work with!

Monday
Jan302012

Client Infographic: Top 20 Medical Records Software Solutions

A new infographic design from InfoNewt for CapterraTop 20 Most Popular EMR (Electronic Medical Records) Software Solutions shows the results of comparing Capterra’s Popularity calculations in the EMR software category.

As the deadline for implementation in the U.S. draws near, talk of electronic medical records (EMR) and electronic health records (EHR) software is a hot topic at the doctor’s office lately. These systems assist medical practitioners in the creation, storage, and organization of electronic medical records, including patient charts, electronic prescriptions, lab orders, and evaluations (just to name a few common features). While the terms “EMR” and “EHR” are often used interchangeably, EMR solutions allow for patient information to be shared within one health care organization, whereas EHR solutions allow for health-related records to be shared across multiple organizations. Below is a look at some of the most popular options in both categories, but to see a comprehensive list, visit our EMR Software Directory. You can also click on any of the company logos in the graphic to go directly to their websites.

Capterra’s listing current shows 324 EMR software solutions, and for their target audience this is a very hot topic with an upcoming Federal requirement in the U.S. to make all medical records electronic by 2014.  This is a HUGE issue to convert millions of patient records over the next few years, and practitioners obviously only want to do this once, so picking the right platform up front is critical!

Similar to the Top 20 Marketing Automation Software design, this design features a large pie chart as the primary visualization, and then provides additional information.  The main data is Capterra’s Popularity calculations which combine total users, customers, revenue, social media followers and website rankings.  Again, the specific percantage values weren’t as important as the ranking and visually showing how the packages compare.

This software category has the added complication that the different software packages are written for different sizes of medical organizations.  Single medical practitioners don’t need the same software (or have the same budgets) as hospitals.  We also added the element of showing which hardware platforms each package is design to use.  Microsoft Windows hardware is clearly dominant, but Apple hardware and Cloud-based solutions made up 30% of searches in this category.

Capterra is the authority when it comes to finding software solutions for businesses, and they’ve done some great work gathering data and measuring the relative popularity of different software categories.  Although popularity doesn’t necessarily mean the software is right for your business, it is a really good indicator that the solution is working successfully for many businesses and may be worth a closer look.  A better indicator than just total revenue or trying to rate “the best.”  You can read their comprehensive blog post about the data behind the infographic.

Thanks to the team at Capterra for being great to work with!

Friday
Dec022011

Client Infographic: The Visual History of Christmas Trees

The Visual History of Christmas Trees is a new infographic from ChristmasTreeMarket.com.  Designed by InfoNewt and designer Jeremy Yingling, this one creates a visual timeline of the major milestones for the Christmas Tree mostly focused on the last 100 years.

The history of the Christmas tree has garnered a lot of fascinating points over the years. A tradition with humble beginnings in 15th century Latvia, the festive tower of foliage has grown to be one of the holiday season’s most beloved symbols. From the first decorated tree in 1600 to Gubbio, Italy’s 650-meter tall wonder, get a glimpse of Christmas tree history through this handy visual guide from Christmas Tree Market.

This one was a lot of fun, and of course is timed to be appropriate for the holidays.  I love how this design turned out, and it was a unique topic that had not received a thorough infographic treatment before.  The design challenge was letting the images shine, keeping the text to a minimum, but still providing the reader with a lot of interesting information.

No matter which side of the Live Tree vs. Artificial Tree debate you fall on, you'll find lots of good information in the infographic.  I bet you'll even learn something you didn't know.  I'm still fascinated by the upside-down Christmas Tree!

Wednesday
Nov022011

Client Infographic: Look Both Ways Before You Cross


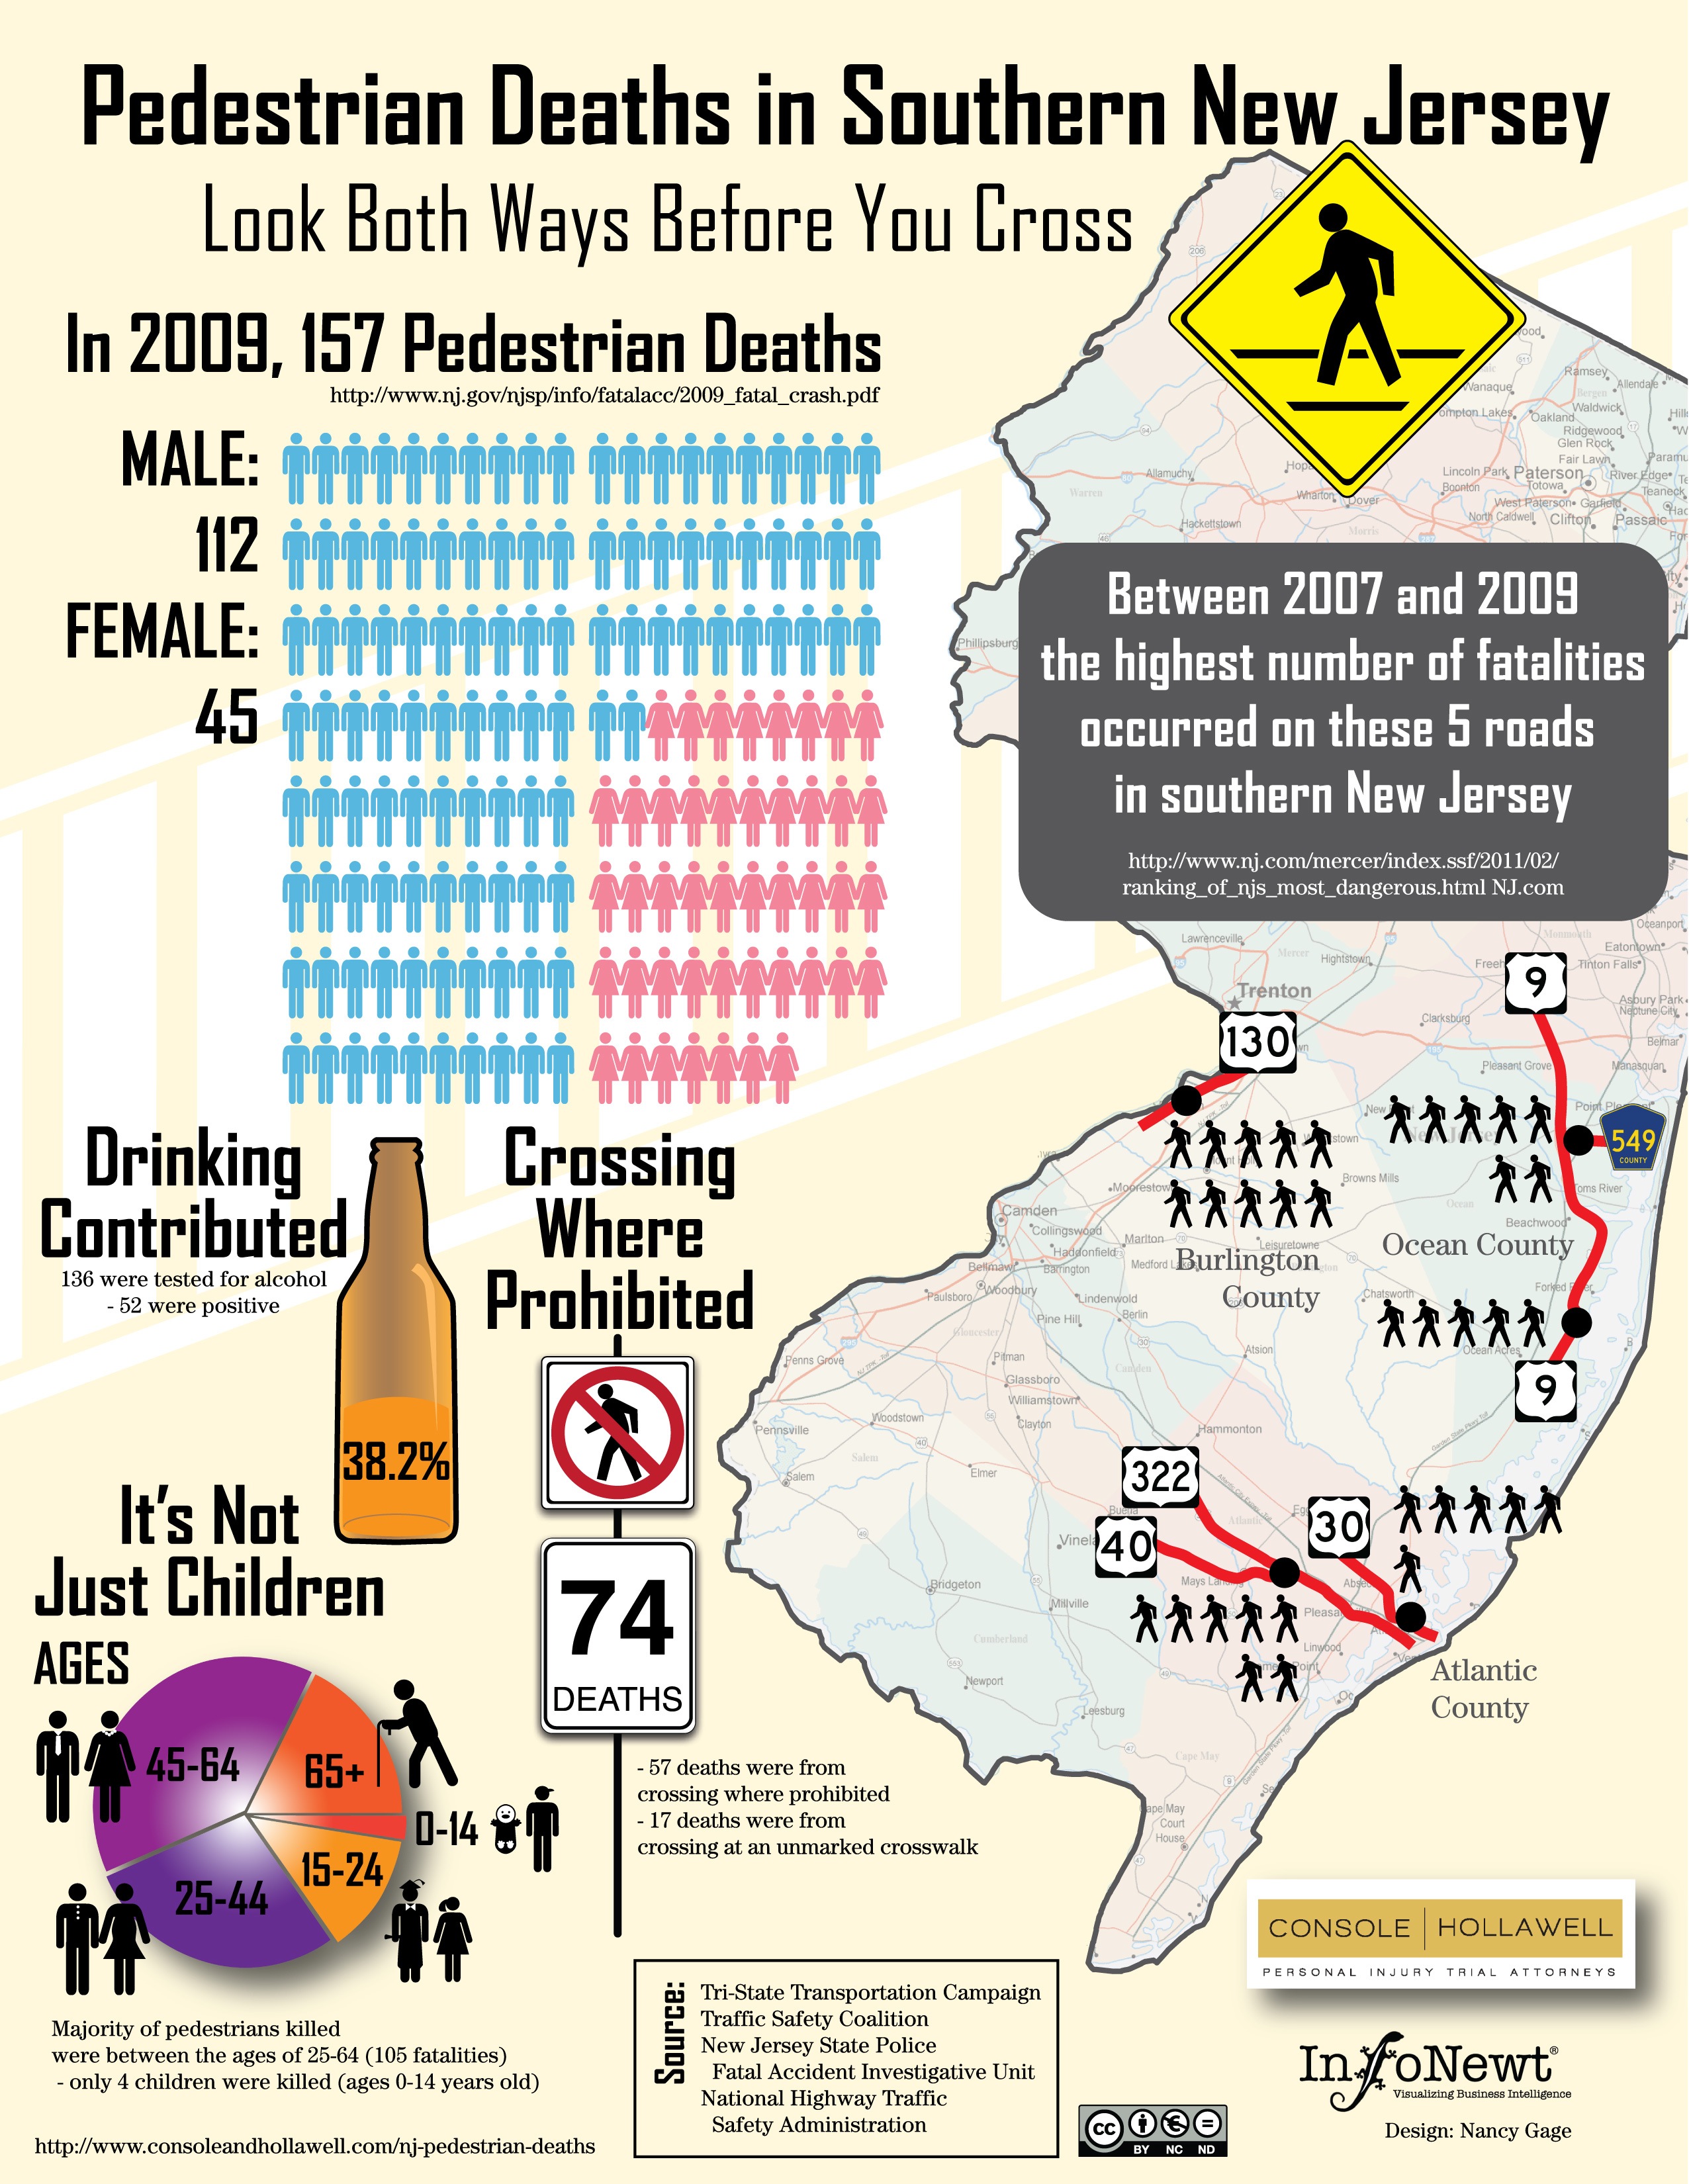
Pedestrain Deaths in Southern New Jersey takes an infographic look at some usually inacessible and hard-to-find data from the different state department websites.  Console & Hollawell worked with InfoNewt and designer Nancy Gage to bring the data together into one infographic that tells a more complete story.

The New Jersey personal injury lawyers at Console & Hollawell receive calls on a daily basis from the unfortunate victims of car accidents across New Jersey and Pennsylvania. We are actively pursuing lawsuits in several cases. In an effort to bring attention to these dangers in New Jersey, we created the infographic below to help bring these statistics to light and ultimately help pedestrians maintain more awareness when crossing these dangerous New Jersey streets.

Although child deaths while crossing the street are the events that get the big headlines in the news, I was surprised that only 4 of the 157 deaths were kids.

Tuesday
Sep272011

Client Infographic: The Hotel Price Index

Hotels.com The Hotel Price Index infographic

Twice-a-year, Hotels.com updates their Hotel Price Index, and this year I was contacted to design some new infographics to go along with the report.  InfoNewt worked with designer Jeremy Yingling to create two infographics for the current set of data from the first half of 2011.  Since the research is global, we created one infographic based on American travelers and one based on Canadian travellers.

The hotels.com® Hotel Price Index™ (HPI™) is a regular survey of hotel prices in major city destinations across the world. The HPI is based on bookings made on hotels.com and prices shown are those actually paid by customers (rather than advertised rates) for the first half of 2011. The report largely compares prices paid in 2010 with prices paid in 2011.

The research is extensive, so we had to keep the information shared in the infographics fairly focused on only a few categories.  This keeps the design clean and easy to read, but also whets the reader’s appetite for more.

We varied the visual designs for each category.  The monument silhouettes attached to locations on the globe was a unique way to show map data and not look like a standard map.  The silhouettes also help the reader recognize the cities faster than reading the text.  It’s subtle, but the lines are color-coded by continent as well.

The Canadian data was a little bit different, so the design had to adapt:

Hotels.com The Hotel Price Index Canadian infographic

You can see the complete report data on The Hotels.com Hotel Price Index page.

Monday
Sep122011

Client Infographic: Sudan, Bombing Everything That Moves


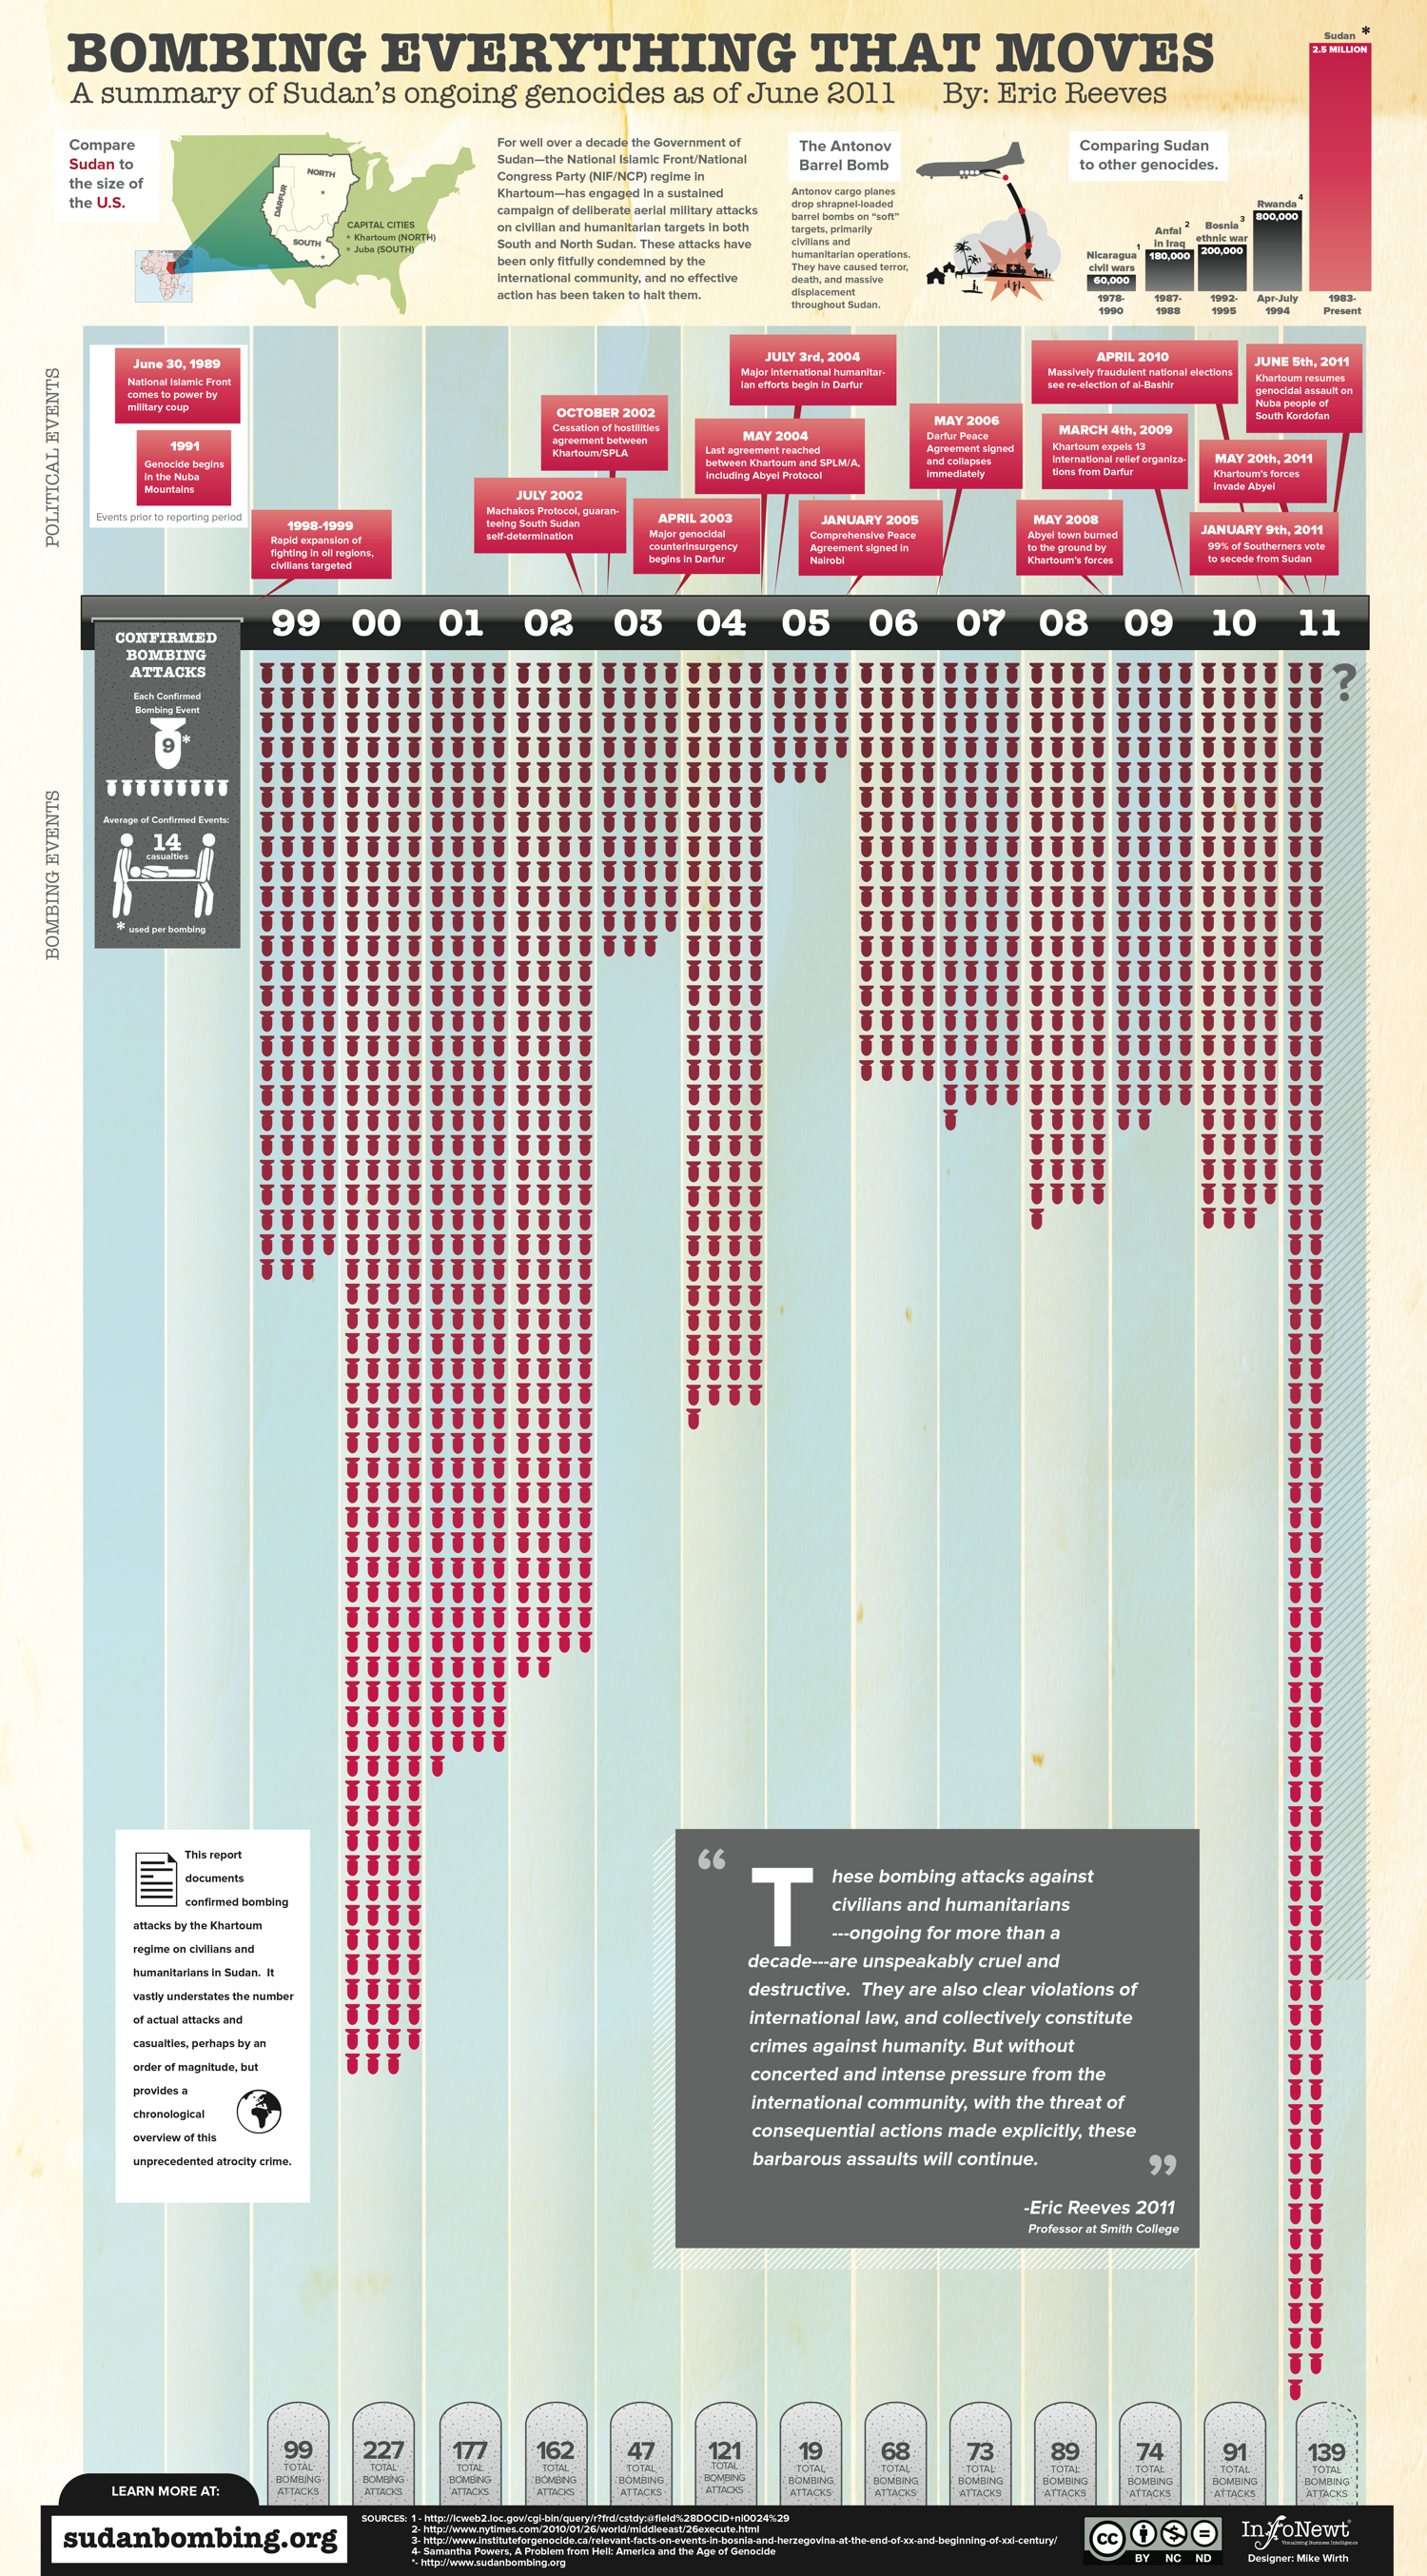
Sometimes, you get the opportunity to work on a project with a very serious topic and global relevance.  Recently, InfoNewt (my company) worked with Prof. Eric Reeves and designer Mike Wirth to design the infographic Bombing Everything That Moves (hosted on Eric’s site SudanBombing.org). 

For well over a decade the Government of Sudan—the National Islamic Front/National Congress Party (NIF/NCP) regime in Khartoum—has engaged in a sustained campaign of deliberate aerial military attacks on civilian and humanitarian targets in both South and North Sudan. These attacks have been only fitfully condemned by the international community, and no effective action has been taken to halt them.

Obviously, the topic is very political.  Prof. Reeves has published an extensive report and makes his Excel data file available to everyone on his site, so I’ll keep my comments focused on the unique challenges we faced when designing the infographic.

The data for this visualization is much different that the readily available Internet stats we see every day.  There is no database to query or reseach data file to purchase.  The exhaustive work Prof. Reeves has done to manually consolidate these confirmed bombing attack reports from U.N. observers, humanitarian aid personnel, radio reports and news reports is a massive, ongoing effort.

Even though the number of attacks in the report was known, most reports had unknown numbers for casualties and the number of bombs used in the attack.  Because of that, the bar chart-style visualization that is the center of the design only shows the number of attacks (a solid number we could work with) and separately shows the average numbers of bombs and casualties from the reports that had that information available.

Data transparency is always important.  As an infographic, the data sources have to be very transparent becuase you want your audience talking about the implications of your information, not challenging your credibility.

Eric Reeves is Professor of English Language and Literature at Smith College in Northampton, Massachusetts. He has spent the past twelve years working full-time as a Sudan researcher and analyst, publishing extensively both in the US and internationally. He has testified several times before the Congress, has lectured widely in academic settings, and has served as a consultant to a number of human rights and humanitarian organizations operating in Sudan.

Due to the nature of this infographic, please keep any comments on the infographic design itself.  Any inflamatory or political comments will be removed based on my judgement.

Tuesday
Aug092011

Client Infographic: A Solar Innovation Story

Solar Savings: A Solar Innovation Story from ExtraSpace.com is a new infographic by InfoNewt and designer Jeremy Yingling.  This one tells the story of how the company is adding solar panels to the roof space on some of it’s self storage facilities all across the country.  The environmental, financial and community benefits are huge, and this was only the first year of a multi-year plan.

Extra Space Storage is on a mission to produce solar powered clean energy and reduce the carbon footprint of our 850+ self storage facilities. We aim to install 20,000 solar panels this year, and increase the pace of panel installation every year. Energy efficient clean power is good for our customers and our neighborhoods, our planet, and our investors. By the end of 2011 this program will save 2,000 tons of carbon dioxide and 100 acres of fir trees.

An infographic is a fantastic way for Extra Space to tell their story to customers, investors and anyone interested in alternative energy solutions.  It puts their efforts into context and shows the potential of how large their cumulative environmental impact could become.

You can follow Extra Space Storage on Facebook and Twitter (@extraspace)