


Wednesday
Apr162008
Quake Family Tree
 Randy
Randy From Wikipedia, the Quake Family Tree shows the history of the Quake computer game engine and all of the other games that were built from each version using a mind map.
Found on digg.com

![]()

Join the DFW Data Visualization and Infographics Meetup Group if you're in the Dallas/Fort Worth area!

The Cool Infographics® Gallery:
How to add the
Cool Infographics button to your:

- iPhone
- iPad
- iPod Touch
Read on Flipboard for iPad and iPhone
Featured in the Tech & Science category


From Wikipedia, the Quake Family Tree shows the history of the Quake computer game engine and all of the other games that were built from each version using a mind map.
Found on digg.com
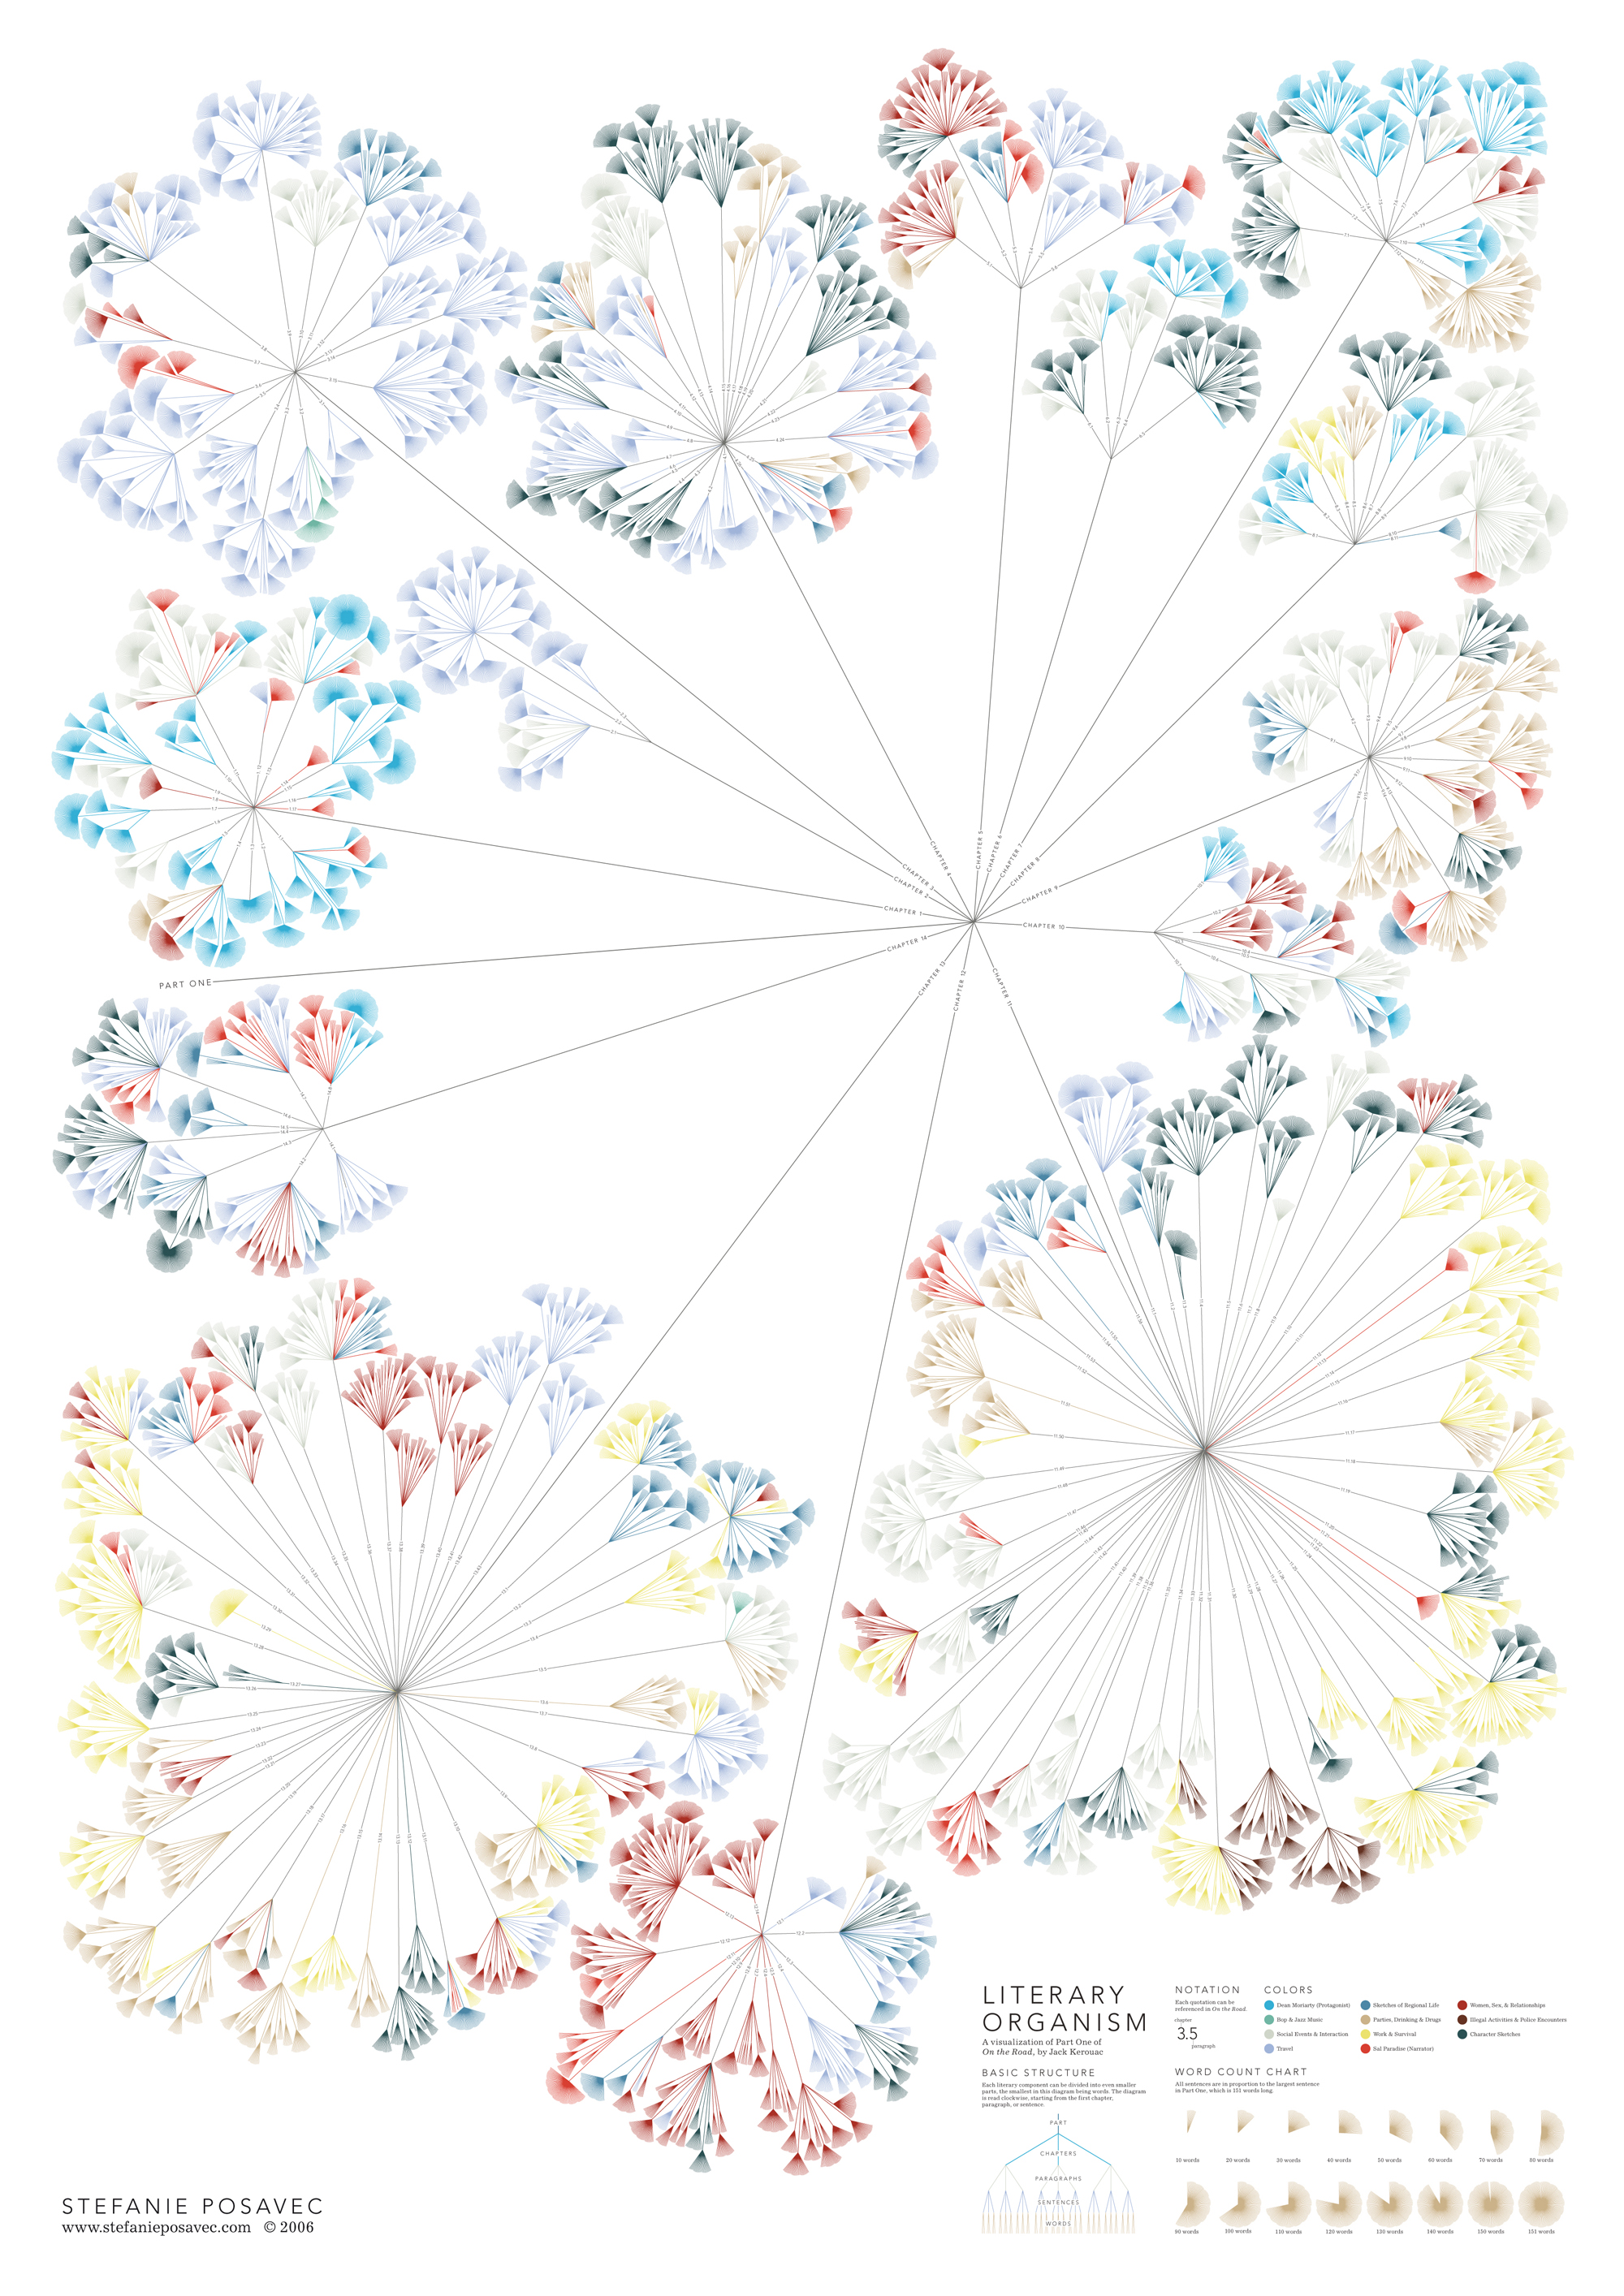
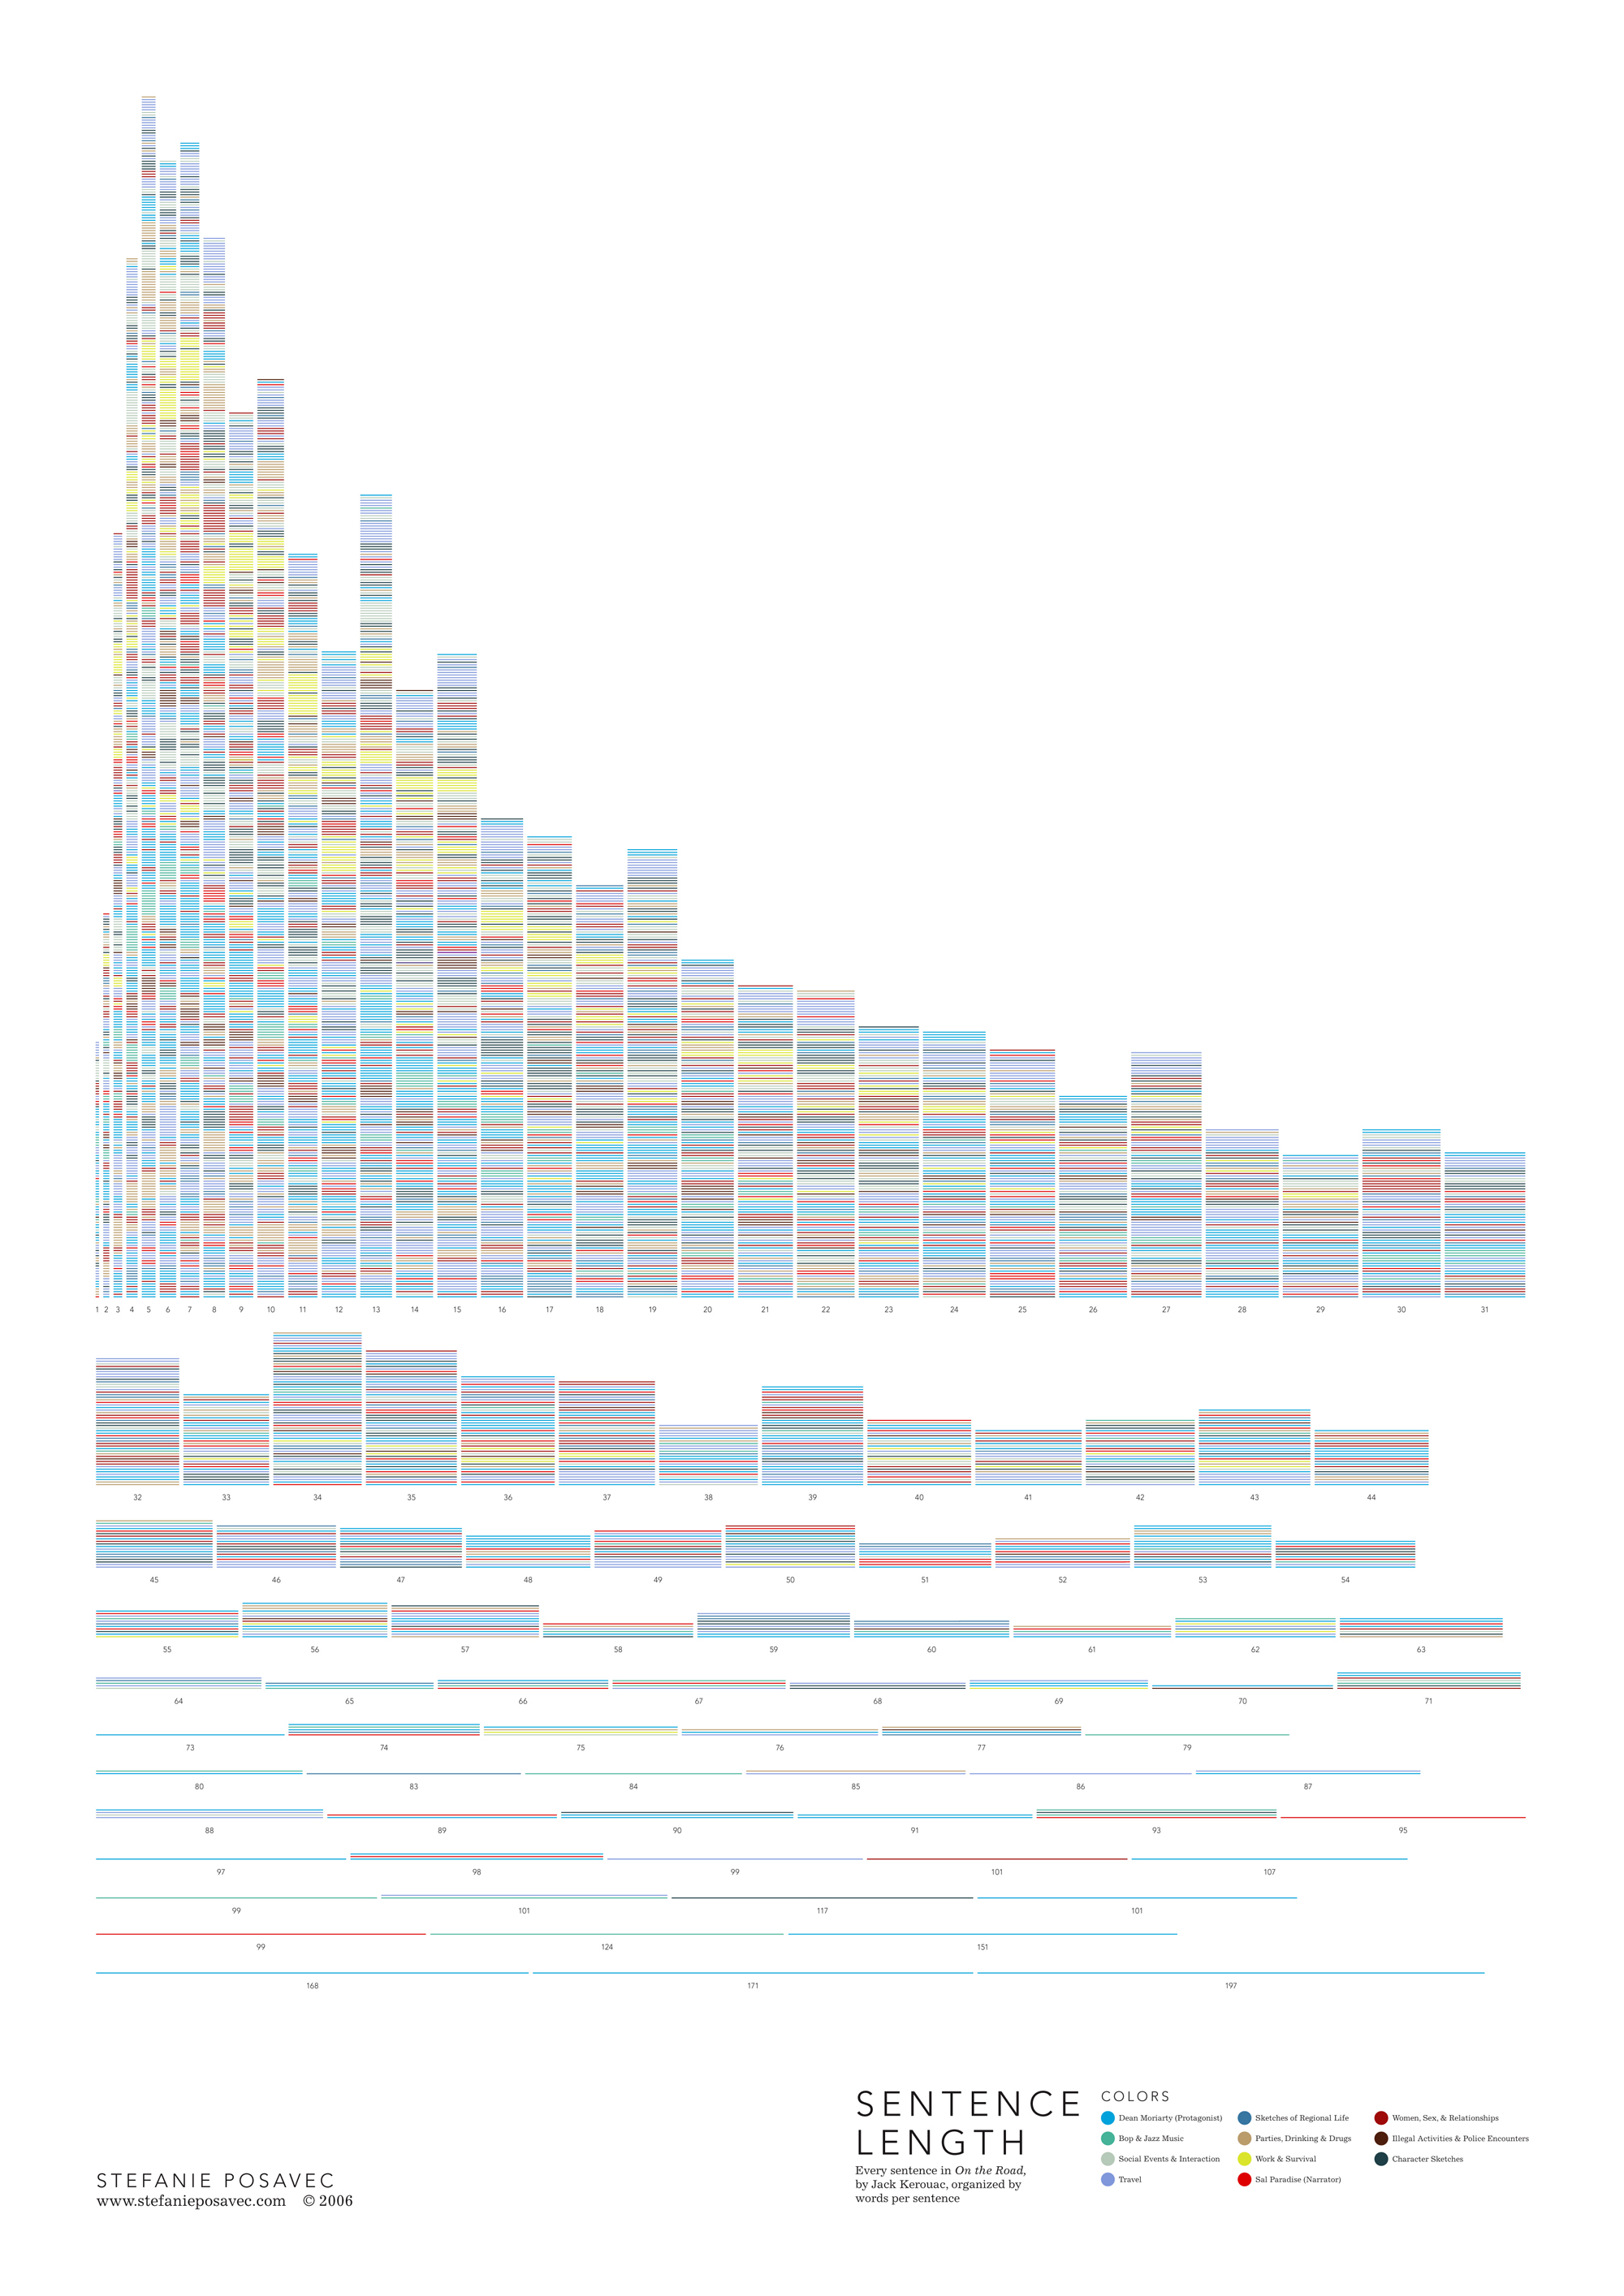
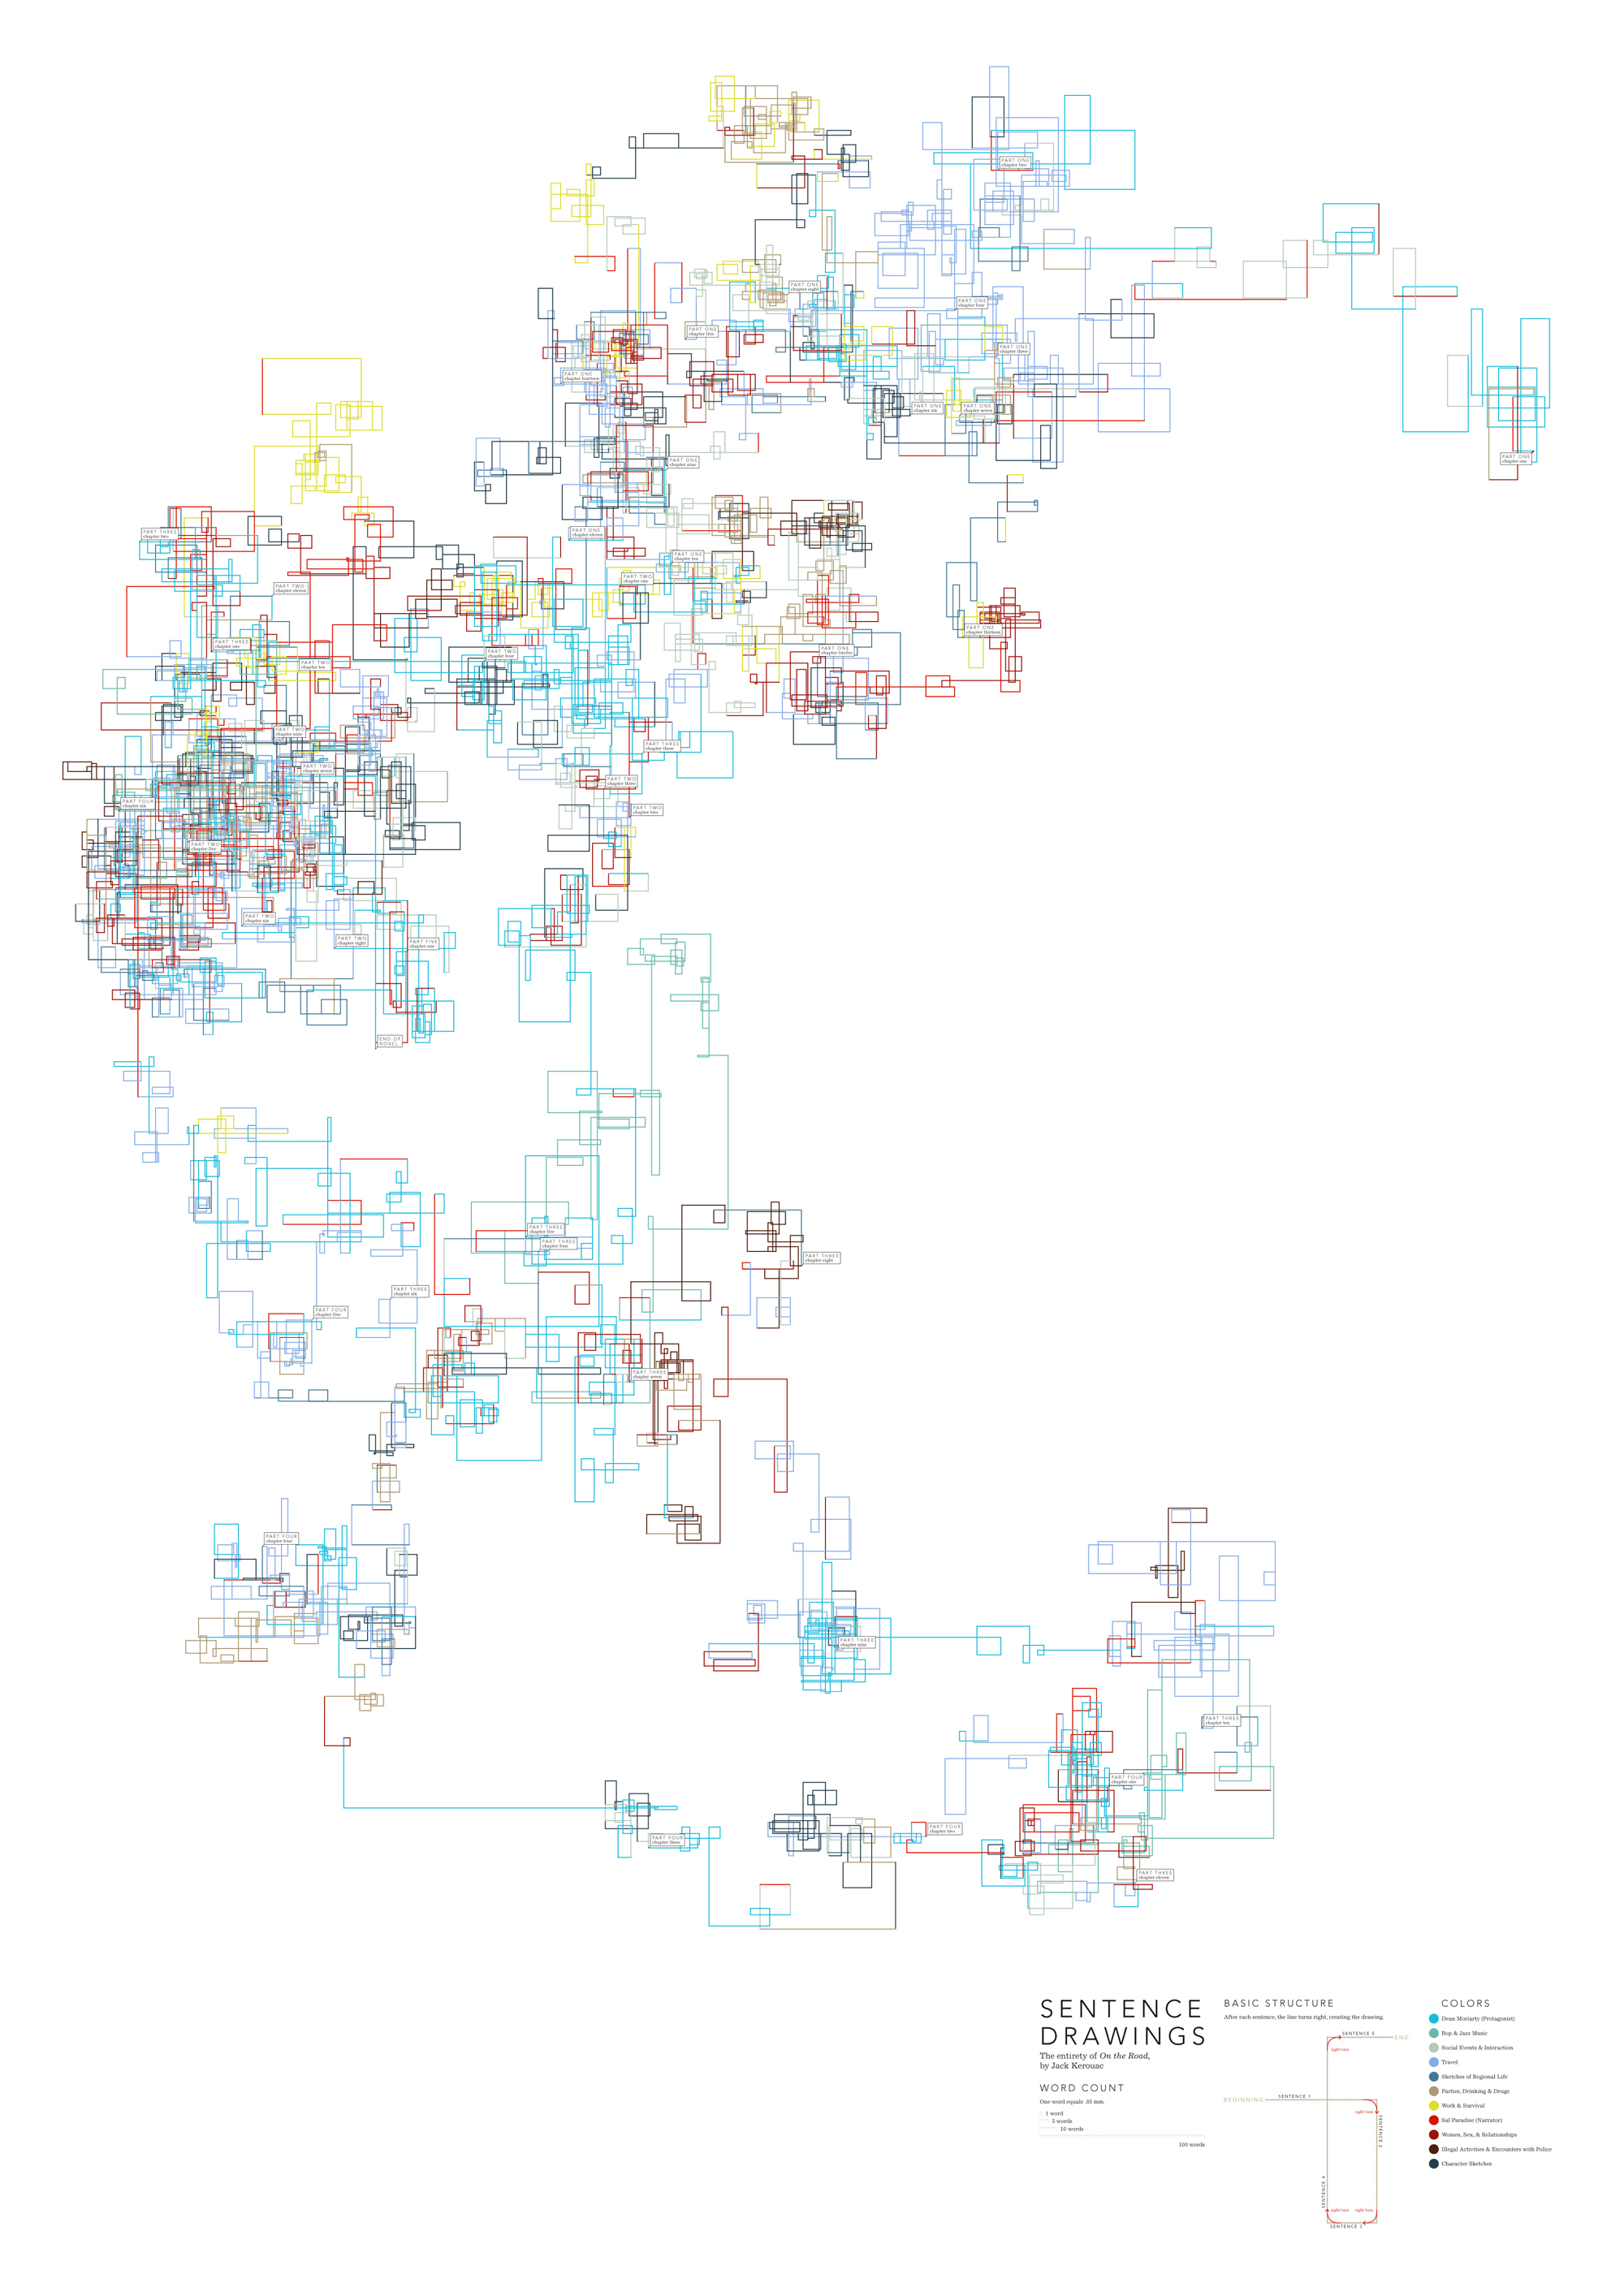
Found on notcot.com, On The Map is a cool project by Stefanie Posavec that maps the rhythm and flow of literary works into some stunning visual posters. Breaking a story down into chapters, paragraphs, sentences and finally individual words. Then color coded to capture the topics as they reappear throughout the story. The level of detail is really impressive. Click the images to see the high-resolution images from notcot.com.
Thanks Jonathon and Jason for sending the link.
Stefanie also created a number of additional visualizations of the same story.


From the The Hewlett Packard Calculator Page.
This poster shows every HP calculator made starting with the famous HP-35. Each calculator is displayed with it's production start and end data, and it's project codename.It's amazing how many of these I have actually used. This is similar to the Evolution of Apple Design...but with more buttons.
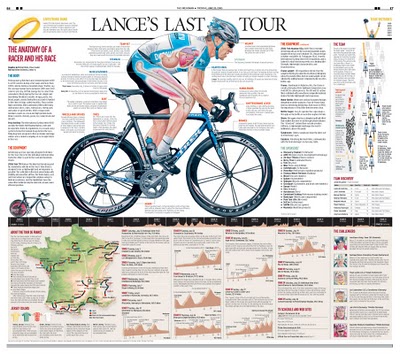
I found two good newspaper infographics from 2005 covering Lance Armstrong's last Tour de France on newsdesigner.com where you can get larger PDF files that make good posters. Both are two-page graphics (doubletrucks). The first is from The Oregonian (above), and the second is from the St. Pete Times (below).

Found on NiXLOG.

Cool infographic poster from historyshots.com showing the many expeditions leading up to the 1953 successful team to make it to the top of My. Everest.
Every major expedition before the successful climb of Mount Everest is detailed on the left side of the print. The circles provide an easy to view key into the history of each expedition including expedition length, type and height achieved. The flow of climbers from one expedition to another is tracked with graceful lines.The right side of the print is devoted to the successful 1953 assault. The entire expedition is mapped showing the exact climbing history by altitude of each of the main phases of the assault. In addition, the weather for each day is provided.
 GE is running The Blueprint Series of five print ads combining photos with an overlay of infographics. This works really nicely because they kept the infographics relatively simple.


 Found on notcot.com.

Another one from Beau and Alan Daniels at beaudaniels.com that I really liked. Superior Coffee is half blueprint, half illustration that helps communicate the Superior Coffee strategy of delivering a better coffee to customers and is used at trade shows. A good way to visually show the technical aspects behind a product.

Humorous infographic that visually explains some of the common golf terms from Beau and Alan Daniels at beaudaniels.com, where you can find a number of good examples of their infographic work.

Cool poster I found over at historyshots.com shows the altitudes reached by all of the U.S. and Russian launches leading up to the 1969 moon landing. From 1961 to 1969 the USSR and the United States were locked in a history-making race to land the first person on the moon. This detailed map explains the story of this titanic contest in a clear and informative manner.

