About
Randy Krum
President of InfoNewt.
Data Visualization and Infographic Design

Infographic Design

Infographics Design | Presentations
Consulting | Data Visualizations

DFW DataViz Meetup

Join the DFW Data Visualization and Infographics Meetup Group if you're in the Dallas/Fort Worth area!

Search the Cool Infographics site

Custom Search

Subscriptions:


Feedburner

The Cool Infographics® Gallery:

How to add the
Cool Infographics button to your:

Cool Infographics iOS icon

- iPhone
- iPad
- iPod Touch


Read on Flipboard for iPad and iPhone

Featured in the Tech & Science category

Flipboard icon

Twitter Feed
From the Bookstore

Caffeine Poster

The Caffeine Poster infographic

Entries in poster (133)

Wednesday
Jan162008

Corporate Connections


I found reference to this graphic by Zohar Manor-Abel on smashingmagazine.com.

What is the connection between 3 celebrities, 35 corporations, 40 subsidiaries and more than 300 brands? Global business interests make up a complex network of connections between corporations from around the world. Corporate Connection, intends to shed light on 'who owns what' in the lobal marketplace and on the intricate nature of the world wide "business" web.

Tuesday
Jan082008

One Year in Iraq


New infographic from nytimes.com depicting the 2,592 deaths in Iraq over the course of the entire year of 2007. The graphic is credited to Alicia Cheng, a graphic designer at mgmt. design in Brooklyn.

The chart below โ€” compiled from data provided by the American and Iraqi governments and news media organizations (the independent Coalition Casualty Count in particular) โ€” gives information on the type and location of each attack responsible for the 2,592 recorded deaths among American and other coalition troops, Iraqi security forces and members of the peshmerga militias controlled by the Kurdish government.

I think this is an improvement over the "31 Days in Iraq" graphic because the new graphic identifies every death as a separate figure instead of grouping some together. There are also some differences in data, as the new graph doesn't include the Iraqi civilian deaths. So the "31 Days in Iraq" graphic showed over 1,900 deaths in January 2007, this new graphic only shows 163 deaths in January.
And, sadly, civilian fatalities in Iraq last year were simply too numerous to represent on a single newspaper page.

I'll keep an eye out in early February to see if they publish one for the month of January as they have the last couple of years.

Saturday
Dec292007

How to Spot a Cylon


This poster for fans of the new Battlestar Galactica is for sale over at QMx for $19.95, so there isn't a high resolution file available. Although, I would propose an image that we could read better would help sell more posters. In the spirit of airline emergency procedure cards, 10 ways to identify a Cylon among us.

Be Aware. Be Vigilant.

EDIT: I noticed this is now available at Amazon too:

Saturday
Dec222007

The Disney Cruise Line Cut-Away


The family took our first Disney Cruise this year, which was fantastic! Here’s a great cut-away graphic of the Disney Wonder, but the other ship, the Disney Magic is almost identical. This graphic is a little out of date, because some things have changed. The ESPN Skybox is now a teen area called The Stack or Aloft depending on which ship you’re on.

The ship is actually quite large, so the spacial representation of locations is really helpful. You can get turned around very easily.

Friday
Dec212007

FREE Infographic Holiday Cards!


This is one of the example infographics from Funnel, Inc. I got a postcard from them offering infographic holiday cards, FREE while supplies last. You won't find the link on their website, but the direct URL is http://www.funnelinc.com/holiday. Order yours quick!

By the way, the example infographic above is "How Books are Made" and shows the entire process to print books at Webcrafters, Inc. in Madison, WI.

Tuesday
Dec182007

Reasons to go to VizThink 2008


In the spirit of practicing what you preach, the team for the VizThink 2008 conference has created a visual guide to "Why come to VizThink 2008?". This graphic definitely has the feel of XPlane. David, did you guys create this one for the conference?

It's coming up soon! Jan 28-29 in San Francisco, CA. (VizThink link)

Friday
Oct262007

Who Owns the Media Companies?


Similar to my earlier post about Who Owns the Car Companies?, I found that Advertising Age magazine has created a poster showing the ownership in the media companies.

You thought the car companies were complicated...

Friday
Oct262007

Science Related Wikipedian Activity


A new visualization from the same group that did the earlier visualization of Wikipedia revision activity. This one focused on science and tech related articles. The mystery is the significance of the blue/green band that crosses the map.

Tuesday
Oct232007

Who Owns the Car Companies?

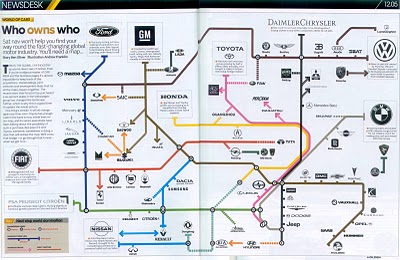
I found three different images showing the complex network of ownership between the automotive companies. Three different attempts at making these complex relationships easier to understand. This first one is a scan from a magazine, but I can't find any reference to which actual magazine it came from. Charted out like a subway map, it's pretty easy to follow.

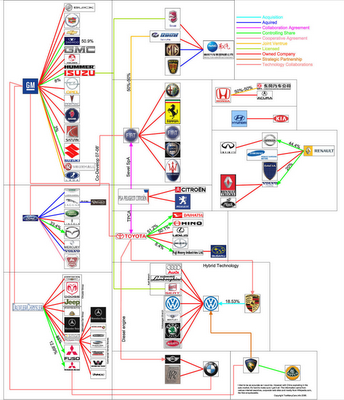
This next one from Too Many Cars is charted like a family tree, or a mind map. It's the easiest the follow, but probably the least aesthetically pleasing. Online the image is broken into smaller pictures so you can zoom closer, but is also available as a large poster in PNG or PDF formats. The data for this one is from 2006, and is the most current of the three.


This last graphic claims to show the ownership mix in the auto industry as a form of bubble chart, but I can't find any date or source data link. I think the bubble sizes represent something, like size of the company or ownership, but I can't tell. So I can't tell how accurate this is. The image is on Tinypic.

Monday
Oct222007

Wikipedia Activity Visualization


From A Beautiful WWW, this image is a pretty good attempt to visualize the article revision activity on Wikipedia. An article explaining the visualization is here, but the image is a combination of images are from the most linked-to articles, and the size of the colored dots represent the amount of revision activity in the linked articles.

A really cool interactive version was made using the Google Maps API so you can zoom in and move around the graphic.