About
Randy Krum
President of InfoNewt.
Data Visualization and Infographic Design

Infographic Design

Infographics Design | Presentations
Consulting | Data Visualizations

DFW DataViz Meetup

Join the DFW Data Visualization and Infographics Meetup Group if you're in the Dallas/Fort Worth area!

Search the Cool Infographics site

Custom Search

Subscriptions:


Feedburner

The Cool Infographics® Gallery:

How to add the
Cool Infographics button to your:

Cool Infographics iOS icon

- iPhone
- iPad
- iPod Touch


Read on Flipboard for iPad and iPhone

Featured in the Tech & Science category

Flipboard icon

Twitter Feed
From the Bookstore

Caffeine Poster

The Caffeine Poster infographic

Entries in poster (133)

Friday
Sep282007

The Wine Advocate Vintage Guide


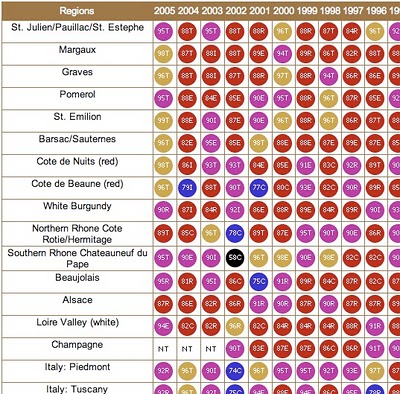
From eRobertParker.com, the online Wine Advocate Vintage Guide. Fascinating guide of wines from 1970-2005. Wines are grouped by region and year, and each group is scored and given a letter code to identify the current maturity status of those wines (like Ready to Drink, Too Old and Early Maturing). The color coding represents ranges of the numeric scores.

The guide is interactive, so clicking on any of the rating circles brings you to a list of the specific wines grouped together for that region. For the specific wines, you can see their individual name, score, maturity level and price range.

A PDF version of the guide is available here for download.

Monday
Sep242007

History of Computer Languages


O'Reilly has created a poster showing the 50-year history of computer languages from 1954 to 2004, available as a PDF. They have also been giving away copies of the posters at O'Reilly conferences. I love the links shown where older languages split or combined to create the newer languages over time.

I look back around 1990 when I was programming in college and see Fortran V, C++ and the birth of Visual Basic. I remember having to convince my engineering professors to let me program assignments in C++ instead of Fortran.

The original diagram was created by Éric Lévénez. Although O'Reilly is not updating the poster, Eric is keeping his original diagram up to date on levenez.com.

Wednesday
Sep192007

The inner mind of a brand geek


A subject near and dear to my heart, I found this poster on Visual Complexity. This map "illustrates the intricate, interwoven relationship between businesses and their brands." The source appears to be 300million.com, which is a Marketing agency in the UK.

I love this map, and I thought this would be a good entry to the VizThink Mind Map Contest.

Monday
Sep172007

Human Trafficking

Found on VisualComplexity.com, this disturbing poster examines global human trafficking.

"It depicts each country's level of involvement (from Very High to Very Low) as either a country of destination or origin. The project concentrates on the smuggling of people from one country to another - mainly illegally. In many cases these people are forced to do work that is illegal, such as prostitution or child labor."
The poster was created by Taulant Bushi, and the original image is here.

Friday
Sep072007

The Cosmic Calendar


This last December was the 10th anniversary of Carl Sagan's death. One of his most popular episodes of Cosmos was titled The Dragons of Eden where he first described his Cosmic Calendar. This website from discovery.com has a simple image showing the Cosmic Calendar as Carl described it. A few websites are selling posters of the Cosmic Calendar, like AllPosters.com.

The premise is that if you compress the entire history of the universe into a calendar year, homo sapiens only exist in the last 6 minutes, and the last second represents the last 400+ years of human history.

You can see Cosmos, and hear Carl describe it on YouTube here:

Saturday
Aug112007

XPLANE offers XPLANATIONS


XPLANE is a company whose whole purpose is professional infographics. They do a bunch of infographics for big and small companies, but also do a lot of work for Business 2.0 magazine (a favorite of mine). Check out David's post that Business 2.0 might be in trouble.

A number of infographics (called XPLANATIONS...I love it) are available free for download here.

David Grey is the CEO, and he also runs his own blog called Communication Nation.

Friday
Jul272007

Web Trend Map 2007 v2


Our friends over at InformationArchitects.com have updated their WebTrends poster showing the...

...200 most successful websites on the web, ordered by category, proximity, success, popularity and perspective. We have done it again – and better. Upon popular demand – here is iA’s next Web Trend Map:
Thanks to Brian Johnson from the Microsoft Mac BU for pointing this one out.

Sunday
Jul222007

Death and Taxes 2008

NEW Death and Taxes infographic for 2008!


It is the 2008 Federal discretionary budget of the United States. is a representational poster of the federal discretionary budget; the amount of money that is spent at the discretion of your elected representatives in Congress. Basically, your federal income taxes. The data is from the President's budget request for 2008. It will be debated, amended, and approved by Congress by October 1st to begin the fiscal year.
So this is what the President is asking for, not the final budget. Compare this to the final 2007 discretionary budget from my earlier post.

An interactive Flash version is online at www.thebudgetgraph.com/poster.

Sunday
Jul222007

Stop Smoking Infographic


Healthbolt.net has a great infographic about how your body reacts to stopping smoking and when it actually starts to recover. It a great combination of a timeline with a description of the symptoms that smoking quitters experience over the period of time.

Information is power, and the understanding of what to expect gives quitters to power to overcome those symptoms. Too many go back to smoking because they didn't understand what they were experiencing was normal.

They had started by selling this as a high-quality poster, but now its available free as an 18MB PDF for anyone to print. Kudos to them to making this availble free to smokers trying to quit everywhere.

Saturday
Jul212007

Evolution of Apple Design


Wow! Have we come that far?!? I remember using the Apple II! The design form has really changed over 30 years (1976 - 2007).

I found this on Guy Kawasaki's Blog, but the original is at www.core77.com