About
Randy Krum
President of InfoNewt.
Data Visualization and Infographic Design

Infographic Design

Infographics Design | Presentations
Consulting | Data Visualizations

DFW DataViz Meetup

Join the DFW Data Visualization and Infographics Meetup Group if you're in the Dallas/Fort Worth area!

Search the Cool Infographics site

Custom Search

Subscriptions:


Feedburner

The Cool Infographics® Gallery:

How to add the
Cool Infographics button to your:

Cool Infographics iOS icon

- iPhone
- iPad
- iPod Touch


Read on Flipboard for iPad and iPhone

Featured in the Tech & Science category

Flipboard icon

Twitter Feed
From the Bookstore

Caffeine Poster

The Caffeine Poster infographic

Entries in poster (133)

Wednesday
Dec102008

10,000+ iPhone Apps Mosaic


To help Apple celebrate 10,000 iPhone apps in the iTunes App Store, TapTapTap created this iPhone mosaic using icons from the available apps.

Check out the TapTapTap blog.

Here is the high-resolution image.

World of Apple is offering the image as a poster for $50

Wednesday
Oct292008

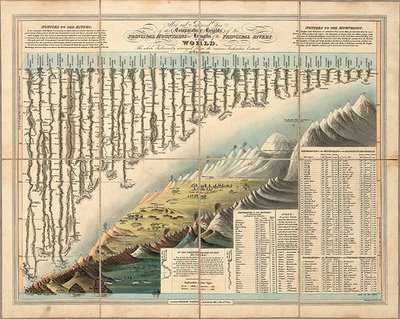
Classic infographic from 1823!


Here's a classic from 1823!  It a hand drawn infographic titled "Comparative Heights of the Principal Mountains and Lengths of the Principal Rivers of The World" by WR Gardner.  The high resolution image is on Flickr, but the post about the image is on bibliodyssey.blogspot.com.

This one makes a great poster!  Thanks Roi for sharing in the comments.

Sunday
Oct262008

Does Your Vote Matter?  YES!


Sticking with the stuff from GOOD magazine, this is one of the GOOD Sheets available for sale as a poster at Starbucks for a limited time.  I've been looking for some good election related graphics.  There are a ton out there, but I'm looking for the gems.

I hear all the time that people don't think their vote matters, and in some cases it may get lost in an election that isn't close or competitive.  However, you never actually know if a race is going to be close or not (unless there is only one candidate).

In some of our local elections, I've seen some decisions put up to vote that won by only 12 votes!

I'm not pushing any specific politcal opinion, just that everyone should get out and vote.  Early voting is already open in many areas, so do your part and be heard!

Wednesday
Oct222008

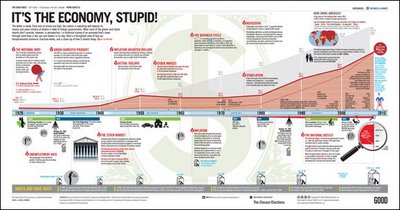
It's the Economy, Stupid!


Great timeline from GOOD Magazine (via picdit.com).
What most of the doom-and-gloom reports on our economy don’t provide is perspective—a historical survey of an economy that’s been through more than a few ups and downs in its day. Here’s a farsighted view of how our temperamental economic machine works, and a close-up of how it stands today.
Thanks Adam!

Monday
Oct202008

NEW Death and Taxes 2009 poster


New Death and Taxes infographic for 2009!  Interactive viewer let's you zoom in to see all of the details.
"Death and Taxes:2009" is a representational poster of the federal discretionary budget; the amount of money that is spent at the discretion of your elected representatives in Congress. Basically, your federal income taxes. The data is from the President's budget request for 2009. It will be debated, amended, and approved by Congress by October 1st to begin the fiscal year.

The poster provides a uniquely revealing look at our national priorities, that fluctuate yearly, according to the wishes of the President, the power of Congress, and the will of the people. If you pay taxes, then you have paid for a small part of everything in the poster. 
The Death and Taxes poster from 2007 was my initial post on Cool Infographics, so I'm very excited to see this update.  Now the 2009 version is available to purchase as a poster here.

Thursday
Sep112008

Laugh System Diagram


I'm back!  I've been on vacation to Walt Disney World in Florida, but I'm back now and its time to catch up on a bunch of great infographics that have been sent in to me.

First, I'll share this one from Disney.  The Laugh System Diagram is from the queue area in the Monsters, Inc. Laugh Floor.  I wish they sold it as a poster.  It seems simple, but I was amazed watching a five year-old explain it in great detail to her parents.

Of course, there are some inside connections too.  The yellow car in the bottom right corner is the car from the animated short on the DVD "Mike's New Car".

Friday
Aug292008

Sony Walkman advertising


This may cross the lines between infographics, advertising and art, but I really liked these advertising posters.  They're real subway maps of New York, London and Sydney, with a little artistic twist to add the ear buds.


I found these on Ad Goodness, and they were created by Saatchi & Saatchi.

Friday
Aug152008

National Debt and the Presidents

First, I'm not pushing any particular political agenda.  There's considerable debate around this chart, so I don't want to start any arguments.  The debate isn't around the validity of the data, but about how it's being presented.  The information is freely available from the U.S. Department of the Treasury and the Bureau of the Public Debt.

Second, I like that this chart takes a simple bar chart and adds a few more layers of information.  At its root, this is a timeline of the increase in the national debt based on the federal budget by year.  Then layered on top of that are the presidents in office that year, some color coding, the political party controlling the White House and highlights for record years.

Third, just to share the reasons for the debate.  This is a great example of data being visualized with a specific agenda in mind.  Obviously, this is a chart framed to make Republicans look bad, and Democrats look good.  The debate centers around a few issues like programs started by one President will carry into the term of another President and more importantly that the political party controlling Congress actually has more impact on the federal budget than the President does.

Friday
Aug082008

The Ropes at Disney


Found on CartoonBrew, this circular chart from 1943 shows the development process of an animated film through the different roles within the Disney organization.  Not exactly an org chart, this is more of a process map.

How do they make those drawings move?  This chart, an separate pull-out from the 1943 booklet, The Ropes At Disney’s (see below), explains the whole process.You’ll note that it all starts with “Walt”. And his main focus was “Story” and “Direction”.

Can you tell I’m going to Walt Disney World today?


Thursday
Jul312008

Anatomy of a Balloon Animal

Now here's an odd poster by Jason Freeny depicting the internal anatomy of balloon animals.  Check it out along with his other works at Moist Productions.  I especially liked that he included visual instructions on how to create the balloon animal at the bottom.

Thank Torquil for sending in the link!

Page 1 ... 7 8 9 10 11 ... 14 Next 10 Entries »