About
Randy Krum
President of InfoNewt.
Data Visualization and Infographic Design

Infographic Design

Infographics Design | Presentations
Consulting | Data Visualizations

DFW DataViz Meetup

Join the DFW Data Visualization and Infographics Meetup Group if you're in the Dallas/Fort Worth area!

Search the Cool Infographics site

Custom Search

Subscriptions:


Feedburner

The Cool Infographics® Gallery:

How to add the
Cool Infographics button to your:

Cool Infographics iOS icon

- iPhone
- iPad
- iPod Touch


Read on Flipboard for iPad and iPhone

Featured in the Tech & Science category

Flipboard icon

Twitter Feed
From the Bookstore

Caffeine Poster

The Caffeine Poster infographic

Entries in Scouts (4)

Thursday
Nov122015

Does Scouting Work?

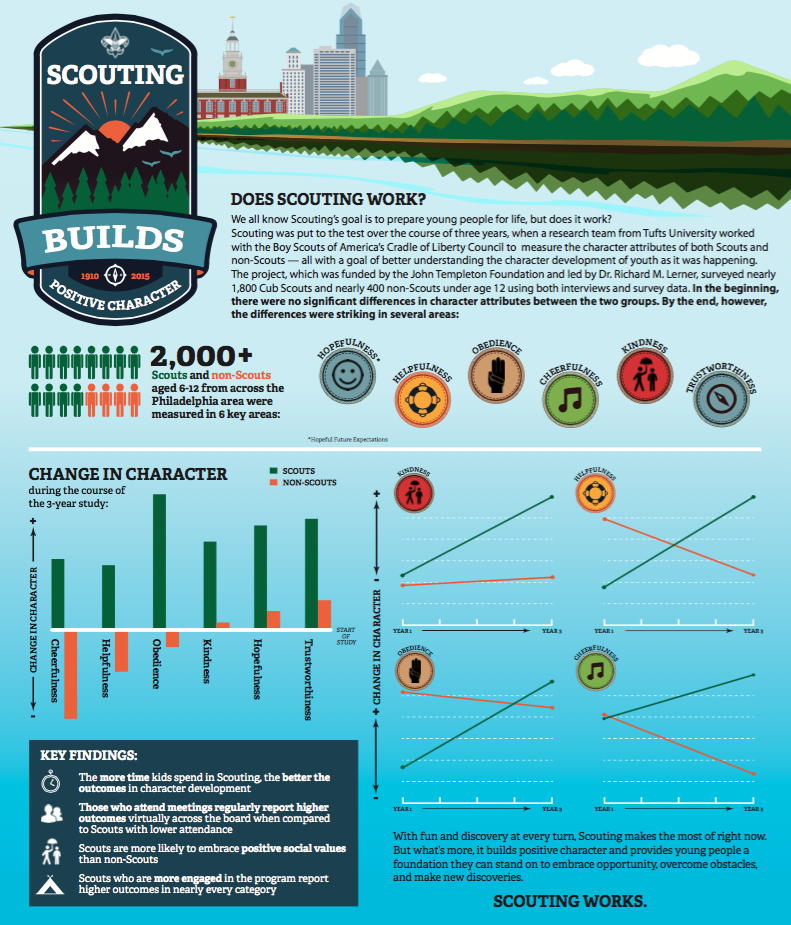
The Does Scouting Work? infographic was created by the Boy Scouts of America based on the results of a study done by Tufts University comparing scouts to non-scouts. The infographic focuses on the four key points from the study and their statistical findings.

The Boy Scouts also created a downloadable PDFpresentation slides and a press release based on the same results and design. This is a great way to leverage the design assets that were created in multiple formats.

Current and former Scouts have always felt that Scouting has made a difference in their lives, and now a study out of Tufts University has found that Scouting does in fact have a measurable, positive impact in the character development of young people.

The study, funded by the John Templeton Foundation, involved nearly 1,800 Cub Scouts and 400 non-Scouts under the age of 12, and was conducted over three years. It sought to measure the difference Scouting makes in young people’s lives as those positive changes were happening.

“After three years, Scouts reported significant increases in cheerfulness, helpfulness, kindness, obedience, trustworthiness, and hopeful future expectation,” said Dr. Richard M. Lerner, who led the study at Tufts University. “In our control group of non-Scouts, there were no significant increases, and in some cases (e.g., religious reverence) there was an observed decrease, which was quite striking.”

In addition, the study found a direct correlation between the amount of time boys spent in Scouting and the positive impact realized—those who spent more years in the program reported higher character attributes. Scouts who were more engaged also reported higher character attributes. And those who attended regular meetings reported higher character attributes compared to those with lower attendance.

It's always great to hear about a program's success when it comes to helping develop kids. By highlighting the research's four best results, they don't end up bombarding a reader with too much information. This could be enough to encourage a parent to enroll their kid in Scouts, or entice a curious reader into learning more about the study and scouts in general.

The infographic appears to have been designed by the national office of the Boy Scouts of America and published here. Many other scouting sites have reposted the infographic, and it would really be helpful to readers to have the URL to the original infographic page in the infographic image. That way readers can find their way back to the original design.


Friday
Aug212015

I Will Survive! A Guide to Survival and Pocket Knives

I Will Survive! A Guide to Survival and Pocket Knives infographic

I Will Survive! A Guide to Survival and Pocket Knives is an infographic that can be helpful for both first timers and frequent buyers of knives.  This infographic can help you pick out the perfect knife based on your potential use of it. Whether it is a survival knife or pocket knife, there are certain features that you should keep in mind.

Whether you’re planning a camping trip, or just like to be prepared, a survival knife is a crucial tool to have. It can be used to cut, dig, split, and pry, to name just a few functions, and its compact, pocket-sized exterior makes it easy to bring with you anywhere you go.

There are multiple options when it comes to survival knives. A fixed blade knife is the most reliable; knives that have a bending joint tend to be weaker. Look for a knife with a full tang. These knives are safer because the blade and the handle are constructed from one continuous piece of metal.

Stainless steel blades are stronger and do not rust as quickly as carbon steel. However, carbon steel knives keep a good edge longer. Regardless of the steel you choose, aim for a solid knife that is between 3/16 to 4/16 of an inch thick.

Unlike a survival knife, a pocket knife tends to have multiple tools. The three most common types are jack, pen, and multi-purpose knives. A jack knife is the most basic of the three, usually consisting of one blade, and a simple hinge. A pen knife has between 2-3 blades and hinges at both ends of the handle. The tools on a multi-purpose knife vary, but the most popular functions include a can opener, scissors, and a screwdriver.

Whether you’re looking for a heavy-duty survival knife or an everyday pocket knife, consult this guide to pick the best one for your needs!

The infographic uses a good balance of words and appropriate graphics to help relay the information well. For the icons and illustrations, I would like to see stronger visuals to help differentiate the good features from the bad.

This infographic appears to have been created by FIX, but it's not clear if the other sites listed Art Of Manliness and Survival Cache were involved in the design or just the sources of information.

Found on Lifehacker

Friday
Jun142013

How to Fold the U.S. Flag

How to Fold the U.S. Flag infographic

Happy Flag Day in the U.S.  June 14, 2013

Found on the Boy’s Life Facebook page.

Thursday
Apr262012

The Eagle Scout Infographic

The Eagle Scout infographic is a new design from the Boy Scouts of America, and shows them experimenting with using infographics to share their message.  It’s odd that I can’t find any mention of it on Scouting.org, but found it posted on the Bryan On Scouting blog, which is the official blog from Scouting Magazine, and posted in the official BSA Twitter stream (@boyscouts).  There’s also a high-resolution PDF file available for download if anyone wants to print it out.

My son just bridged over to Boy Scouts from Cub Scouts, and their national office is here in the DFW area, so I was naturally interested.  This is a really good first attempt at an infographic design from their design team, but makes a few mistakes visualizing the data.

  • Good use of the red, white and blue color scheme.  It’s clearly scouting, and specifically related to Eagle Scouts
  • The data being presented is fantastic since only the BSA would have access to many of these statistics.
  • I love the choices of imagery used.  The embroidered patches and icons used for the scouts keeps the design clean and easy to read.  Many BSA publications use a lot of full-color photos of the scouts, and that would have added too much visual noise to an infographic design.
  • The BSA logo at the top clearly identifies this as an official publication, but it’s missing a title.  What should we call this infographic?  Why should I read this infographic?  Something like “100 Years of Eagle Scouts: By The Numbers” would have worked nicely.
  • The information included will change over time since the data is a current snapshot of the state of Eagle Scouts.  2,151,024 Eagle Scouts as of what date?  The infographic should more clearly identify the date that the data is gathered from, because people will be looking at this for years on the Internet.
  • Filling unusual shapes to show percentages is always a challenge.  With images like the hand icon and the globe you can’t just calculate the height of the colored area like a bar chart.  You have to calculate the AREA of the space to be colored, or you end up with false visualizations like these.
  • The same is true for sizing shapes, like the people icons for the Average Age of Eagle Scouts visualization.  You have to size the overall AREA of the shapes to match the data being presented, which is hard with complex shapes.  You can’t just change the height.
  • The space shuttle avoids this issue by only coloring a rectangular shape in the middle, turning it into a stacked bar chart, but the visualization doesn’t match the data.  The red colored section is visualizing more than 60 astronauts as Eagle Scouts, when the number shown is only 40.
  • I love the Eagles by Decade data, but avoid 3D charts.  The 3D effect doesn’t add anything to the data being presented and it’s incosistent with the rest of the design.  The data tells a great story, and clearly shows that Boy Scouts continues to grow strongly and is a viable organization in the 21st century.
  • I like this use of the word cloud for Notable Eagles, but don’t change the font sizes because in infographic design this is assumed to convey data.  With Brave and Loyal in larger fonts, it implies that these are more important than all of the other virtues.  The virtues should all be one, consistent font size, and the names should all be a second font size.
  • At the bottom, there should be a copyright (or Creative Commons) statement, and a URL for readers to be able to find the original high-resolution version. 

Thanks to Dean for sending in the link!