About
Randy Krum
President of InfoNewt.
Data Visualization and Infographic Design

Infographic Design

Infographics Design | Presentations
Consulting | Data Visualizations

DFW DataViz Meetup

Join the DFW Data Visualization and Infographics Meetup Group if you're in the Dallas/Fort Worth area!

Search the Cool Infographics site

Custom Search

Subscriptions:


Feedburner

The Cool Infographics® Gallery:

How to add the
Cool Infographics button to your:

Cool Infographics iOS icon

- iPhone
- iPad
- iPod Touch


Read on Flipboard for iPad and iPhone

Featured in the Tech & Science category

Flipboard icon

Twitter Feed
From the Bookstore

Caffeine Poster

The Caffeine Poster infographic

Entries in travel (66)

Thursday
Aug022012

Find the Best Airline Fees

Find the Best Airline Fees infographic

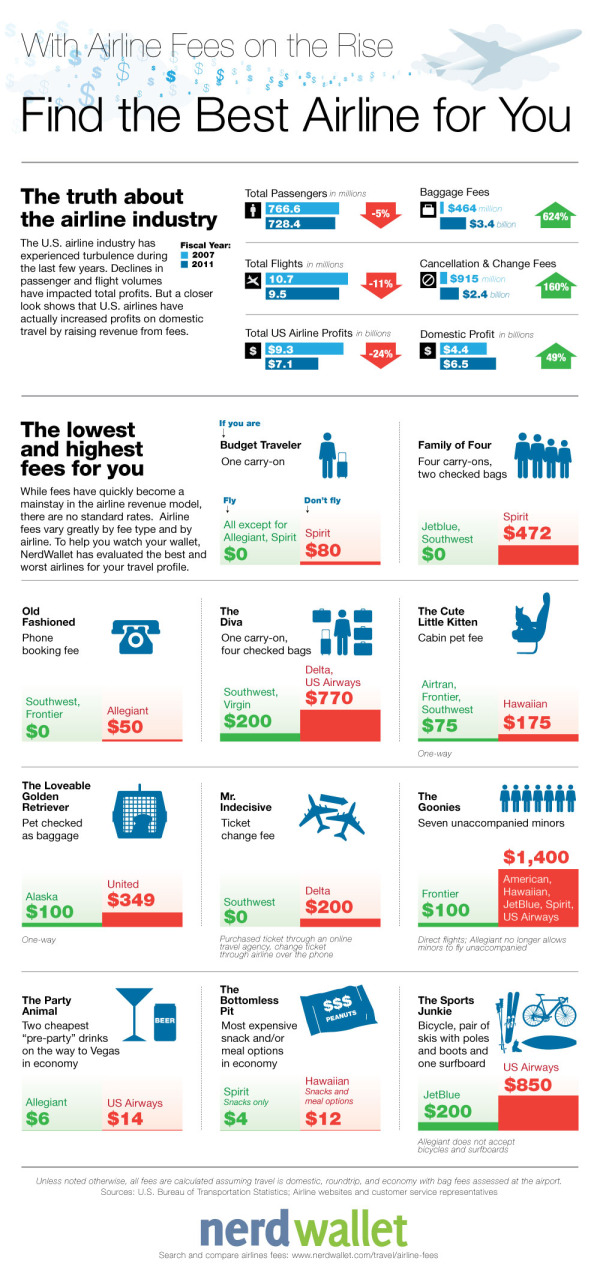
Traveling is a pleasure that we don’t want to give up, but costs keep rising! Find the Best Airline For You infographic from Nerd Wallet lets you know which airline to travel on depending on your traveling habits to keep the costs down!

U.S. airlines continue to increase fees - more fees and higher fees.  However, there are no standards or regulations when it comes to airline fees so travelers don’t know what to expect.  Fee prices range widely by airline, and there is little transparency on the terms of each fee.  For example, some fees are charged based on how stops are made, while others are billed as flat fees.  Some fees have a base rate but increase from the time of booking to boarding the plane.  
As a result, cost comparison is extremely difficult, especially when travelers are evaluating multiple airlines.  To make matters worse, fees are not properly disclosed – they are hidden within multiple layers on airlines’ websites and shrouded by vague wording.  NerdWallet gathered the data and analyzed each fee across all major U.S. airlines.  To help travelers save money, we defined several traveler profiles and calculated fees on a comparable basis to determine which airline is best (and worst) for each type of traveler.

There are a handful of things I like about this one.  

  • The main thing is that throughout all of the Lowest/Highest comparisons, the scale of the bar charts is kept consistent.  This allows the reader to easier understand how much money is related to each travel fee.
  • The green-red (good-bad) color scheme is instantly understandable to the reader.
  • The icons (all in blue) are easy to understand.  By keeping them all a consistent solid blue color, they are kept simple and don’t create a bunch of “visual noise” that would distract the reader.
  • Sources are listed at the bottom
  • The direct URL to the original infographic is included at the bottom so readers can find the high-resolution original no matter where they find it posted on the Internet.

I would suggest using the airline logos, even in a solid color, to make it easier for the readers to pick out the airlines they recognize.

Thanks to Annie for sending in the link!

Friday
Jul202012

HAMAP Gourmet Burgers in Milan

 HAMAP Gourmet Burgers in Milan infographic

 HAMAP Gourmet Burgers in Milan infographic
HAMAP Gourmet Burgers in Milan infographic


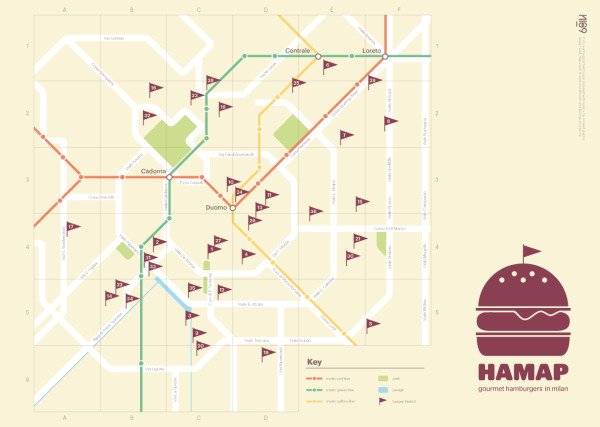
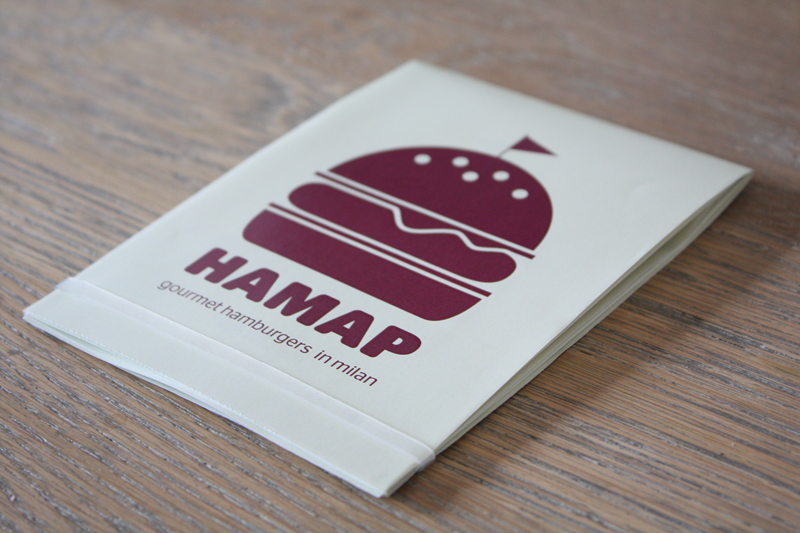
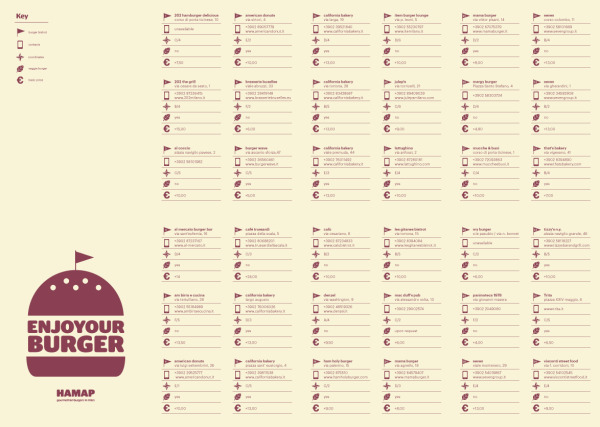
This is neat! From a convenient square to a helpful map! And the most important thing is that is points out gourmet hamburger joints in Milan, Italy!  A must have when traveling. Check out the HAMAP created by Nico and can be found at hamap.tumblr.com and behance.net.

Nico is working on making these available for purchase, but if you’re going to be in Milan before that you can email Nico at info@nico189.com.

A personal project that was born from my passion for burgers. This map shows some Milan’s bistrot where you can enjoy a good sandwich.
Now I prefer the home made by my girlfriend, who was my co-pilot in this project. 

The map is the main focal point of this printed design, but the back side includes all of the details about each restaurant like the address, GPS coordinates, phone number, veggie burger availability and average price.  The map locations are obviously visulized, but it would have been nice the the prices to be visualized as bars behind the numbers to easily compare prices at the different locations.

HAMAP Gourmet Burgers in Milan infographic


Great job Nico!

Monday
Jun042012

Eat at the Best British Restaurants for Less Than You Think

Eat at the Best British Restaurants for Less Than You Think

If you ever find yourself in the UK, this will be a very helpful infographic! The Michelin Star Lunches infographic from thetrainline.com keeps your belly, taste buds, and wallet happy!

For passionate foodies, Michelin star food is one of the finer things in life. However, for many of us, such top quality dining may feel out of reach price-wise. In fact, a day out to enjoy the finest dining (maybe taking the train and enjoying a guilt-free glass of wine or 2) could be as affordable as £15 for two courses at the two star gastro pub, the Hand & Flowers in Marlow. Even fine dining in London is affordable with 3 courses at Arbutus, Soho for just £17.95.

Look at our handy guide to all the Michelin starred restaurants in the UK above - shown in order of their most affordable set lunches.

This is a fantastic, informational, reference infographic to help you find outstanding food at reasonable prices…as long as you go for lunch instead of dinner.  Color-coded by region of the country, and organized in ascending price range, this design tells one story really well.

Seriously, if you travel or live in the UK, I would keep a copy of this infographic on your phone just so you could easily lookup these highly rated restaurants near you.

Thanks to Luke for sending in the link!

Wednesday
May302012

How Mobile Technology is Changing World Travel

How Mobile Technology is Changing World Travel

Do you use your smartphone to help make traveling easier? If you do, then your part of a huge growing trend. The How Mobile Technology is Changing World Travel infographic from MyDestination.com shares some interesting statistics when it comes to traveling. 

Back in 1903 when the Wright Brothers first took flight in their first fixed winged aircraft, little could anyone have imagined what travel would become. Fast forward to 2012 and the internet has revolutionised travel – along with communication – with the birth of the smartphone. But just how much as this palm-held device influenced and changed our travelling habits? And just how far has travel–based mobile technology still got to go?

There’s a lot of information gathered from many different sources in this one, which is one reason it’s so long.  The use of mobile devices to plan your travel and the use of them during your travel are definitely growing, and this infographic does a great job of helping the readers get some basic understanding of what’s going on.

A few issues with the data visualization designs though:

  • The doughnut charts at the top are hard to read because the edges are so thin.  A thicker area around the circles would have been easier to see.
  • How can the UK have 129% Mobile Penetration?  By definition that number can’t be higher than 100%.
  • The visualization using the airplane silhouette is challenging.  There should be 10 windows to easily visualize the 74%.  Readers think in tens, and it’s hard to understand a portion of six windows.  I’ll bet the 54% color fill is close, but I have no way to figure out if it’s accurate.
  • Again, readers think in tens, so don’t show the “…traffic for 78% of travel sites” as a visualization of seven computer monitors, use ten.
  • At the bottom should be a copyright, and the URL to the original infographic landing page

My Destination is also asking readers for suggestions for their next infographic design:

Are you an avid smartphone user abroad? Can’t imagine life without Facebook on the move? Don’t have a smartphone and not intending on caving in? We want to hear from you! Whether you are embracing the mobile travel revolution or just love travel, we want to know what is getting you talking. We’re also on the lookout for ideas for our next infographic special. Email hq.socialmedia@mydestination.com with any suggestions or tweet us @MyDestination using #TravAndTech.

Thanks to Oli for sending in the link!

Monday
Apr092012

CSR and Sustainability Report: Volvo Shaping the Future of Transport

Volvo’s new infographic puts their 2011 CSR (Corporate Social Responsibility) and Sustainability Report into a tidy, easy to read design! Shaping the Future of Transport focuses on Volvo’s environmental, economic, and social responsibility.

All you need to know about the Volvo Group’ CSR and Sustainability Report 2011.

The Volvo Group’s vision is to become world leader in sustainable transport solutions.  We’re convinced that efficient transport is crucial for societal and economic development.  We have the skills, resources and global reach to shape the future of transport.

This is a fantastic use of an infographic as a corporate communication tool.  Volvo is using this infographic as an awareness tool to put their Sustainability Report in front of more readers and broaden the awareness of their efforts.  It’s designed as a top-level overview, and if the reader wants more information, they know how to find the full report.

The illustrations obviously represent the varied forms of transport that Volvo is involved in, and my only criticism is that the design is mostly text.  They list locations, percentages, company historical events and other statistics about Volvo that should all be data visualizations.  At they bottom, they should include the URL to the original landing page, and a copyright statement.

On the original landing page, the whole infographic is a link to their online Sustainability Report front page, but it would have been nice for them to use an HTML Image Map to make the separate statistics and call-outs link to the specific, related web pages in the report.

Thanks to Gustaf for sending in the link!

Friday
Mar302012

Guide to the Final Four Ticket Pricing

Timely for the Final Four on Saturday, the SeatGeek to the Final Four infographic takes a fun look at the expenses related to anyone headed to New Orleans to watch the Final Four games in person.

The infographic stands on its own nicely without any description, and I really like the design.  Of course they used a basketball court wood flooring as the background, and carefully didn’t use any official Final Four logos from the NCAA.  Even the jerseys are helpful illustrations and avoid using any official school logos. 

I like most of the data visualizations.  The line charts are simple, and the map is easy to read with clear driving paths.  The Flying vs. Driving comparisons are also very easy to understand, but should have been visualized.

The design makes one big mistake!  Only a couple data sources are mentioned at all (Kayak.com and Hipmunk.com), so we are left to wonder if the rest of the data is accurate. Did the rest of the data come from the SeatGeek servers?  Where did the historical ticket prices come from?

The ticket price chart title indicates that they only charted the actual face value of the tickets, but they probably should have been adjusted for inflation.  The doughnut charts for ticket sales by state and by city are hard for the viewer to compare, and I think it was a poor choice of visualization method.  Aren’t these supposed to add up to 100%? 

The visuals are very heavily weighted at the top of the design layout, and it’s disappointing that the information becomes mostly text at the bottom.  My guess is that the designer was running out of time.  The Total Spent values and the spending comparisons also should have been visualized.  As an infographic designer, you should never make fake visualizations either (like showing 40 Hurricanes from Pat O’Brien’s next to the actual value of 125).

It’s interesting that they didn’t include the URL to the find the original infographic at the bottom, it’s really an ad URL to their Final Four page of ticket sales.  I would have recommended including both URLs.  There’s nothing wrong with the link to the sales page, but you should also include the infographic URL.  There should also be a copyright statement at the bottom as well.

Thanks to Ryan for sending in the link!

Tuesday
Mar272012

Seven Motorcycle Safety Tips

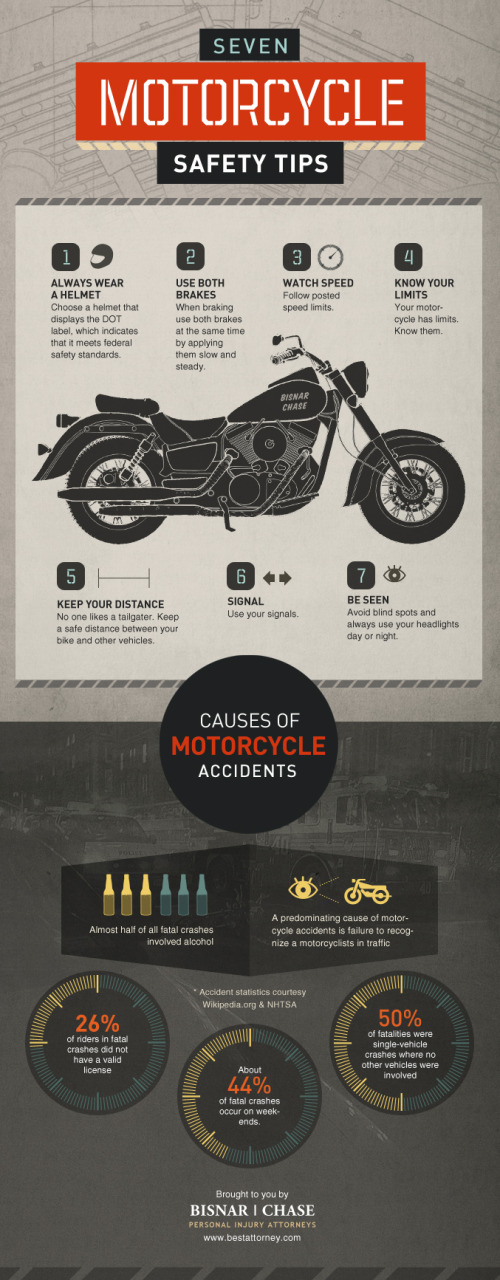
The Seven Motorcycle Safety Tips infographic comes to us from Bisnar|Chase. This infographic gives some helpful tips on saftey to prevent injuries, but if you do have an accident, they’d like to help!

Motorcycle safety is no joking matter. Please take your safety seriously. If you do become injured in a motorcycle accident we would like to help. Contact us immediately to schedule your free consultation with our reputable California motorcycle accident lawyers.

A couple things I really like about this design.

  • It tells a simple, easy-to-understand story
  • Clean design, not too much visual noise
  • Good illustrations to illustrate each safety tip and statistic
  • Each of the values included are visualized to make them quick and easily to read

The data source is listed in the infographic, but it’s missing a copyright statement and a URL to the original infographic posting at the bottom.  The page with the original posting is also missing sharing buttons for social media, so it’s difficult for readers to share the infographic.

Thanks to Chris for sending in the link!

Thursday
Mar012012

Australian Tourism Infographic

Who doesn’t dream about going to the land down under? So if your curious about who is coming or going in Australia, planning a mini-vacation, or perhaps a permanent vacation, the Australian Tourism infographic from WeWish has the information for you!

The only thing we like more than being on holiday is planning a holiday! Find out where everyone is heading this year. This infographic shows people moving in and out of Australia. It also shows the top destinations to visit when down under.

I love how clean this design is!  The information in sequence from top-to-bottom tells a good story about tourism in Australia.  However, a couple of the data visualizations are a bit hard to understand:

  • In section 1, the percentage share of global arrivals is the red circle for each country, and theoretically these are all portions of a whole 100%.  It’s very hard for the viewer to compare the sizes of the circles between countries.  The nested circles visualization style shown for each country is a visualization really intended to compare those particular circles among themselves.
  • In section 3, the green arcs visualize the percentage change from 2009 to 2010, but an arc visualization is intended to show a portion of 100% like a pie chart.  None of these specific values exceeded 100%, but that type of data could have and the visualization would have broken down because it’s not appropriate for this type of data.  You could have a 200% increase from the prior year.

A couple things missing from the bottom of the design.  The URL to the original infographic posting, and a copyright statement.

Thanks to Stefan for sending in the link!

Tuesday
Feb142012

Sinking of the RMS Titanic vs. Costa Concordia

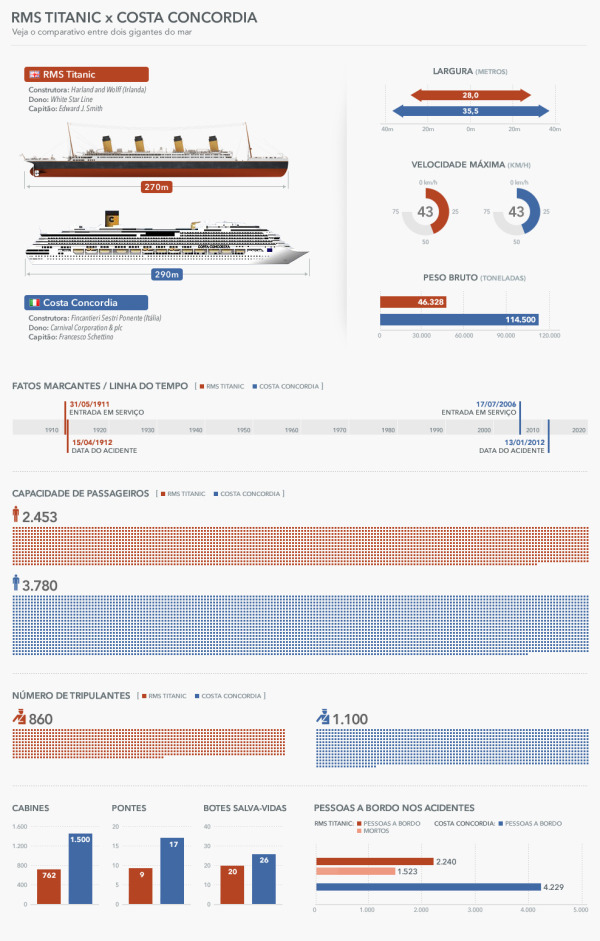
RMS Titanic vs. Costa Concordia (Veja comparação entre o naufrágio do Costa Concordia e do Titanic infographic) from Ultimo Segundo in Brazil compares the crash of the Costa Concordia (Blue) to the Titanic (Red).

Alguns dos sobreviventes do acidente do Costa Concordia compararam o naufrágio do navio italiano, que tombou após bater em uma rocha na costa da Ilha de Giglio em 13 de janeiro, com o do Titanic. “Concebido para ser inafundável”, segundo a operadora White Star Line, o RMS Titanic naufragou em 15 de abril de 1912 após ter-se chocado com um iceberg no Oceano Atlântico duas horas e quarenta minutos antes, na noite do dia 14.

ENGLISH TranslationSome of the survivors of the crash of the Costa Concordia compared the sinking of the Italian ship, which sank after hitting a rock on the coast of the island of Giglio on 13 January, with the Titanic. Designed to be unsinkable,” according to the operator White Star Line, RMS Titanic sank on April 15, 1912 after it collided with an iceberg in the Atlantic Ocean two hours and forty minutes before the night of the 14th.

What a great design!  The best thing about this design is that it’s in Portuguese, but the visuals still make it understandable to anyone that doesn’t know the language!  I understand the comparison between ship sizes, the dates of service on the timeline, the passenger capacities and the number of people aboard during the final accidents.

Thanks to Guilherme for sending in the link!

Wednesday
Feb082012

Client Infographic: Hotels.com Romance Survey


Hotels.com has released two Romance Survey infographics that share their own research behind romance and Valentine’s Day.  Designed by InfoNewt with designer Jeremy Yingling, the two versions cover research data both the U.S. and Canada.

Pack your bags, Sweetie Pie, we’re going on a romantic getaway!  We surveyed guys and gals of different ages who shared their secret dreams about the perfect romantic weekend.  Here’s how our lovebirds responded.

It’s fun, timely information that has a long Online Lifespan (won’t change over time), so the infographics will be relevant for years.  There was a lot of survey data, and I really like how the final result mixes up different ways to look at the aggregate data by also using the available demographics to show findings by age and gender.

I was impressed with the chivalry shown by 58% of men (both in the U.S. and Canada) that feel they need to plan and pay for a romantic Valentine’s date.


Thanks to the Hotels.com team for being great to work with!