About
Randy Krum
President of InfoNewt.
Data Visualization and Infographic Design

Infographic Design

Infographics Design | Presentations
Consulting | Data Visualizations

DFW DataViz Meetup

Join the DFW Data Visualization and Infographics Meetup Group if you're in the Dallas/Fort Worth area!

Search the Cool Infographics site

Custom Search

Subscriptions:


Feedburner

The Cool Infographics® Gallery:

How to add the
Cool Infographics button to your:

Cool Infographics iOS icon

- iPhone
- iPad
- iPod Touch


Read on Flipboard for iPad and iPhone

Featured in the Tech & Science category

Flipboard icon

Twitter Feed
From the Bookstore

Caffeine Poster

The Caffeine Poster infographic

Entries in world (200)

Monday
Feb092009

"The Graph" - The Future of Solar Power


Known as "The Graph" in scientific circles, this chart projects the future of solar power.  It was highlighted in a Fast Company article in December 2008.
The Graph was created by a scientific organization that counsels the German government, but it has since become a prized piece of propaganda, embedded in glossy brochures and PowerPoint presentations by solar companies from California to gray-skied Saxony. At the left-hand, present-tense end of the scale, solar power is a microscopic pencil line of gold against the thick, dark bands of oil and natural gas and coal, an accurate representation of the 0.04% of the world's electricity produced by solar power as of 2006. The band grows slowly thicker for 20 years or so, and then around 2040 a dramatic inversion occurs. The mountain-peak lines indicating the various fossil fuels all fall steeply away, leaving a widening maw of golden light as solar power expands to fill the space. By 2060, solar power is the largest single band, and by 2100 it is by far the majority share.

Friday
Feb062009

ARRRRR! Where are the Pirates?!?


I had to post this one.  TorrentFreak.com revealed that The Pirate Bay has quietly released a Google powered map site that shows the locations of the bit-torrent clients.  Of course they carefully maintain the anonymity of their users.


You can click on the icon over a particular country to see their statistics.  From everything I hear, I would have thought the U.S. to have more pirates...ARRRRR!

Thanks Alwyn!

Wednesday
Jan282009

The Ultimate Mammal Family Tree


This is very cool.  Going back 166 million years to see each of the branches where we share common mammalian ancestors.  The PDF is available for download, and is very detailed.  You need to zoom a long way to even see that there is text naming each of the known mammals in existence today.  It's a radial family tree that also represents a timeline as you move outwards from the center.  Here we are:


ABC TV in Australia did a short video on the family tree hosted by Dr. Paul Willis, and he literally walks around the infographic describing different parts.  Well done, and seemed very reminiscent of Carl Sagan in some of his shows.  The video credits Robin Beck, a Mammalian Systematist as the University of NSW, of creating the family tree.  Here's the link to the ABC page where you can watch the video, or you can click on the image below.


Thanks for the link Alwyn!  Great find!

Monday
Jan262009

Modern Day Pirates


Pirates infographic from the Russian News and Information Agency.  These are real pirates at sea (not online pirates stealing software, music and movies).  433 victims and 292 kidnappings in 2007! (EDITED: there were only 5 deaths, not 433)
Article 100 of the United Nations Convention on the Law of the Sea (UNCLOS) requires that all states fight against piracy.  The annual damage from piracy to the global economy is around 15 billion Euros ($12 Billion).
This one and many other infographics are available online at the Russian News and Information Agency's infographics page.

Friday
Jan162009

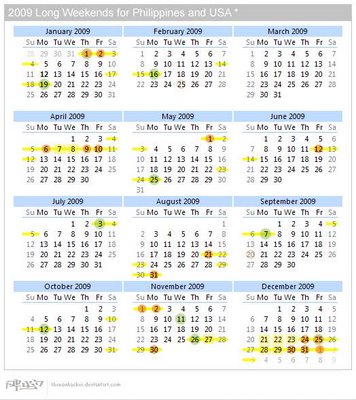
Long Weekends Calendar


The Long Weekends Calendar was created by thenonhacker (Alwyn Balingit) and posted on DeviantArt.com.  By plotting the holidays in both the U.S. and the Philippines, he has mapped out all the long weekends that need to be considered when creating project timelines involving people in both countries.

It's also good to plan vacation time...

Great job Alwyn!

Wednesday
Dec242008

The Tallest Building: Burj Dubai


The Burj Dubai is a construction project to build the world's tallest building in Dubai.  Their website has a nice interactive comparison to the other key skyscrapers in the world.  The photo-like images on a black background with the reflection is very similar to the Apple Computer photo slideshows.
The goal of Burj Dubai is not simply to be the world's highest building.  It's to embody the world's highest aspirations.  Burj Dubai looks different depending on where you're standing.  For those living nearby, it is a shining accomplishment - tangible proof of Dubai's central role in a growing world.
Thanks Alwyn!

Tuesday
Dec232008

Immigration to the U.S. 1820-2007


Immigration to the US, 1820-2007 v2 from Ian Stevenson on Vimeo.

Cool video by Ian Stevenson (hosted on Vimeo) that animates the origins and number of people that immigrated to the U.S. every decade from 1820 to 2007.

Thanks Garrett for the link!

Friday
Dec052008

The Species-Scape

Christopher Taylor posted this image on his Catalogue of Organisms blog, and it has raised a little controversey about the details.  The intent is that the relative size of each organism in the image is representative of the number of species in that group.  So the large fly represents the huge number of insect species.  Towards that intent, I believe the image succeeds, but I have read some disagreement about the specific numbers used to develop the image.

In case you're wondering where the mammals are, we're represented by the reindeer cowering underneath the mushroom.

Two very similar images with some differences are also available.  One from the University of Sydney:

And another on from Cornell University: (this link wasn't working for me)

No matter which is exactly correct (and there's no way to tell), you get the point how small number of species of mammals are compared to the others.

Thanks Kevin, for sending in the link!

Wednesday
Nov192008

The history of olympic medals

 
Grace Lee is a Junior at Parsons, the New School for Design in New York City.  She went back and visually laid out all of the medals won be every country in every Olympics since Athens in 1896.  Across the bottom it also shows how many nations participated each year and how many athletes were involved.  This was a project in her Information Design class, and she did a fabulous job!
The games have always brought of this world together in peace, leaving behind any racial or cultural boundaries.  The Olympic games create a time when the world can be smaller and united as a human race, rather than separate nations.  With the summer games in Beijing, China, and the upcoming games in Vancouver, Canada, the Olympic games will continue to be a time of friendly competition.

Thanks Grace.  I love how this project turned out.

By popular request I have uploaded the full PDF version here.

Thursday
Oct302008

The Future of Food


Wired magazine has a great series of nine infographics from the November issue about the world's food supply problems.
Forty years ago, advances in fertilizers and pesticides boosted crop yield and fed a growing planet. Today, demand for food fueled by rises in worldwide consumption of meat and protein is again outpacing farmers ability to keep up. It's time for the next Green Revolution.
Thanks for the link Ethel!  Here are a few more.  Check them all out on Wired.com.