About
Randy Krum
President of InfoNewt.
Data Visualization and Infographic Design

Infographic Design

Infographics Design | Presentations
Consulting | Data Visualizations

DFW DataViz Meetup

Join the DFW Data Visualization and Infographics Meetup Group if you're in the Dallas/Fort Worth area!

Search the Cool Infographics site

Custom Search

Subscriptions:


Feedburner

The Cool Infographics® Gallery:

How to add the
Cool Infographics button to your:

Cool Infographics iOS icon

- iPhone
- iPad
- iPod Touch


Read on Flipboard for iPad and iPhone

Featured in the Tech & Science category

Flipboard icon

Twitter Feed
From the Bookstore

Caffeine Poster

The Caffeine Poster infographic

Entries in world (200)

Wednesday
Oct292008

Classic infographic from 1823!


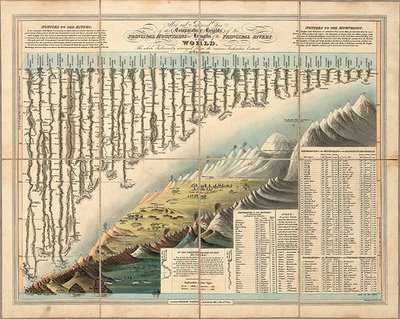
Here's a classic from 1823!  It a hand drawn infographic titled "Comparative Heights of the Principal Mountains and Lengths of the Principal Rivers of The World" by WR Gardner.  The high resolution image is on Flickr, but the post about the image is on bibliodyssey.blogspot.com.

This one makes a great poster!  Thanks Roi for sharing in the comments.

Monday
Oct132008

Air Traffic Worldwide movie

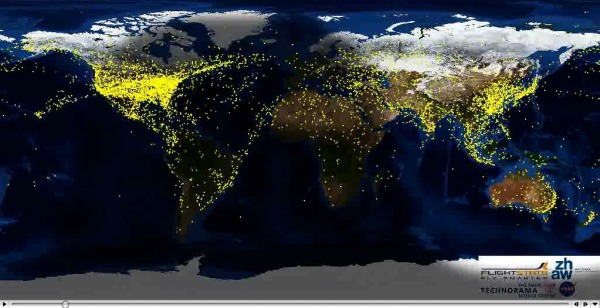
Very similar to the Flight Patterns video I posted back in October 2007, this is a video showing all commercial flight in the world over a 24-hour period.  The previous video was only the U.S., but this one shows the entire world.  It also shows the day/night areas and you can see the increase in air traffic as dawn rises around the world.  Its from the Zhaw School of Engineering in Zurich.

Found via FlowingData.com

Thursday
Oct092008

Watercube, The Book


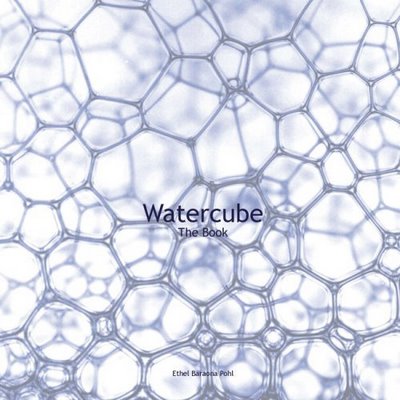
Watercube, is a new book by Ethel Baraona Pohl.  The book is about the National Aquatics Centre built in Beijing for the 2008 Olympics, and has some cool infographics inside.  Some of the graphics were contributed by architect César Reyes Nájera.  A review of the book can be found here on www.v2com.biz
WATERCUBE: The Book is a complete monographic publication about the National Swimming Center for the Beijing Olympics 2008. With an exhaustive description about the Watercube we present a detailed study of the project. The book makes an holistic approach to the project that starts with a brief description of urban and social changes that China has been experienced in the last decade. These facts have encouraged the construction boom that made possible these kind of projects occur in cities like Beijing.

 
This page compared the amount of steel used to built the Watercube to some of the most well known buildings around the world.
This page shows a comparison to the same set of buildings around the world, but shows the tons of CO2 produced due to the steel used in their construction.


This page is one of the years of the timeline leading up to the construction of the Watercube.

Here you can buy Watercube, by Ethel Baraona Pohl, on Amazon.com.

Special thanks to Ethel for sharing the images from her book, and allowing me to post them on Cool Infographics!

Thursday
Aug282008

VizThink Europe Discount Code!


I know many of my readers would really enjoy the conference VizThink Europe, and the conference is coming up quickly.  The Europe version is in Berlin, Germany this year on October 12-14 at Crown Plaza Berlin City Centre.
We'll have lots of opportunities for hands on experiences, learning from industry gurus, and networking with your visual thinking peers. We'll be bringing a few of your favorite facilitators from San Francisco with all new content, plus a whole lot of new facilitators from Europe.
The great guys at VizThink have created a discount code for readers of Cool Infographics.  Use the code BCRK01 when you register to get €50 ($75-$80 in U.S. dollars these days) off any regular attendance fee (not student, Government or non-profit rates).

If you can get to Berlin (and I have a lot of readers from Europe), you would really get a lot from attending.

Big thanks to the guys at VizThink!

Saturday
Aug232008

Olympic Wrap-Up


To complete the week of Olympic Infographics from the NYTimes.com, they have created a page to summarize all of the infographics they created.  They've been adding to it every day, so it won't actually be complete until the Olympics are over.

Friday
Aug222008

Beijing Air Quality Index


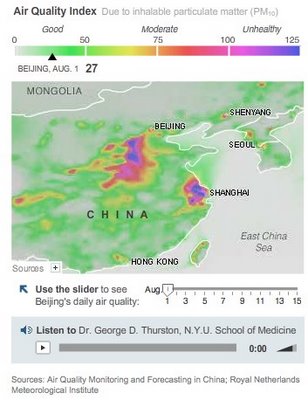
NYTimes.com is also tracking the Air Quality Index by day during the Olympics using a heatmap style graphic.  There's definitely more pollution and particles in the air than most of the participants are used to.  So far, there have been a couple of days in the 90's, but didn't cross over 100 into the "unhealthy" range.

Thursday
Aug212008

Olympic Maps of Beijing


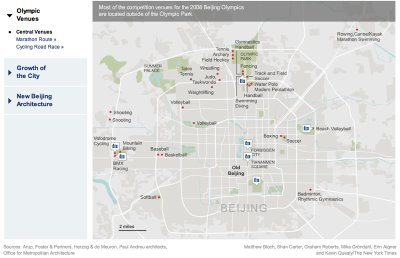
Let's not forget the Maps!  NYTimes.com has a number of interactive maps of the Beijing area showing the event locations, new architecture built for the Olympics, the demolition and expansion of the old city over the last 10 years, the new subway routes and some of the routes for the marathon and cycling events.

Wednesday
Aug202008

Olympics Schedule Tracker


The Olympics Tracker is an interactive schedule of the events.  It now only shows which events are scheduled each day and hour, but you can drag them to rearrange your favorites to the top.  Clicking on past events shows the results, and clicking on future events shows the upcoming event details.  Medal awarding events marked with a small medal icon.  You can even download a desktop version for Mac or Windows.

Tuesday
Aug192008

Olympic History of World Records


The History of World Records from NYTimes.com shows how the world record in a number of Summer Olympic events has progressively been beaten over the last 100 years.  In this chart, the Men's 100m Freestyle record was beaten three times this year improving the world record by 0.45 seconds.  Similar events are all charted together, so you can see other freestyle events on the same chart.

Monday
Aug182008

Olympics Medal Count Map


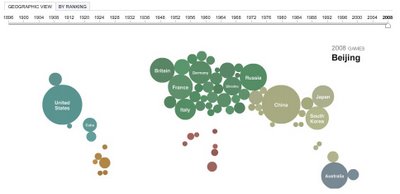
The Medal Count Map from the NYTimes.com show the total number of medals each country has won in every olympics since 1896.  Choose a year on the timeline to animate the graphic.  Rolling your mouse over a country will show the breakdown of Gold, Silver and Bronze medals and clicking will bring up a complete list of the events and medal winners.