About
Randy Krum
President of InfoNewt.
Data Visualization and Infographic Design

Infographic Design

Infographics Design | Presentations
Consulting | Data Visualizations

DFW DataViz Meetup

Join the DFW Data Visualization and Infographics Meetup Group if you're in the Dallas/Fort Worth area!

Search the Cool Infographics site

Custom Search

Subscriptions:


Feedburner

The Cool Infographics® Gallery:

How to add the
Cool Infographics button to your:

Cool Infographics iOS icon

- iPhone
- iPad
- iPod Touch


Read on Flipboard for iPad and iPhone

Featured in the Tech & Science category

Flipboard icon

Twitter Feed
From the Bookstore

Caffeine Poster

The Caffeine Poster infographic

Entries in chart (27)

Monday
Aug272012

The Visual History of Swimwear

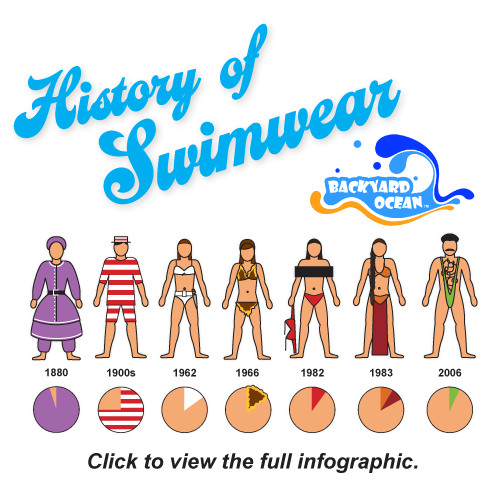
The History of Swimwear Swimsuits infographic by Backyard Ocean

The History of Swimwear infographic is a visual timeline from Backyard Ocean that shows the evolution of the swimsuit over the last 150 years.

The swimsuit: a symbol of stylish summer fun. Parade it on the beach or in the privacy of your above ground pool at home. Swimwear’s history has grown from cavemen furs to science fiction fancies. Artsy, classy, conservative or sexy, the swimsuit is an icon of summer style and fashion. Backyard Ocean takes a breath from swimming to see just how the swimsuit has changed through time. CLICK on the image to enlarge!

The History of Swimwear Swimsuits infographic by Backyard Ocean

This is a design by Jeremy Yingling with InfoNewt (my company).  Each model on the timeline has an illustration showing off the fashions, and represents either a new suit design or a famous example from TV & movies.  My favorite part is the associated pie chart visualizing the amount of skin coverage for each swimsuit (or lack thereof).

The design also plots the amount of skin coverage over time, the evolution of the “thong” and how skin exposure does not automatically equate to higher sex appeal.

Thanks to the team at Backyard Ocean! 

Tuesday
May152012

Ingeniously Charting The Horrifying Power of Today's Nuclear Bombs

Ingeniously Charting The Horrifying Power of Today's Nuclear Bombs


Anyone remember what color the “tons” were on the infographic?  The Ingeniously Charting The Horrifying Power of Today’s Nuclear Bombs infographic by Maximilian Bode (posted on fastcodesign.com) puts the power of the Tsar bomb into painful perspective (but seriously my fingers hurt from scrolling). 

A simple, but great design that puts some truly huge numbers into scale for the reader to understand.

Wednesday
Feb152012

Website Hosting Decisions

The Hosting Decisions, From the Chalkboard infographic from Rackspace UK Hosting helps customers to choose how to host their site with this visually decision map.

OK so you already know that we’ve been helping customers define their hosting needs for some years now.

But as customers adopt more service based computing resources like cloud hosting, it’s only logical that they will also now ask more of their hosting provider to ensure they are getting the correct solution.

So we thought hey, let’s produce an infographic to take customers through a simple decision making process on a route to the solution that’s right for them.

This one is a clear, focused topic.  Easy to read, and not a lot of illustrations or images to get in the way.  This decision for companies is actually a little more complicated, but the infographic does pose the right questions.

Thanks to Sav for sending in the link!

Monday
Dec122011

Client Infographic: Top 20 Marketing Automation Software Solutions

Designed here at InfoNewt for Capterra, the new infographic: The Top 20 Marketing Automation Software Solutions explores the relative Popularity of different software companies playing in the Marketing Automation arena. 

In this design, I used a pie chart to represent the total Popularity of the Top 20 solutions, and connected the related company logo to each slice as appropriate.  It was a specific design choice to list the rank number, but not the specific percentage of each slice.  Because the data was gathered and combined from a number of different sources that can change daily, the results needed to be informational at a general level and valid for a longer period of time.  Visually, you can quickly and easily understand the relative popularity, but the specific value isn’t relevant to any purchase decisions.

An infographic product comparison is a great way to help buyers cut through the clutter and add value.  There are currently 184 software solutions listed in the Marketing Automation category directory, so buyers need some way to compare products and make an informed decision.

Capterra is the authority when it comes to finding software solutions for businesses, and they’ve done some great work gathering data and measuring the relative popularity of different software categories.  Although popularity doesn’t necessarily mean the software is right for your business, it is a really good indicator that the solution is working successfully for many businesses and may be worth a closer look.  A better indicator than just total revenue or trying to rate “the best.”

Designed in OmniGraffle, and I cleaned up the logo images using Pixelmator.

Thanks to Mike and the great work from the team at Capterra!

Tuesday
Mar222011

The Radiation Dose Chart

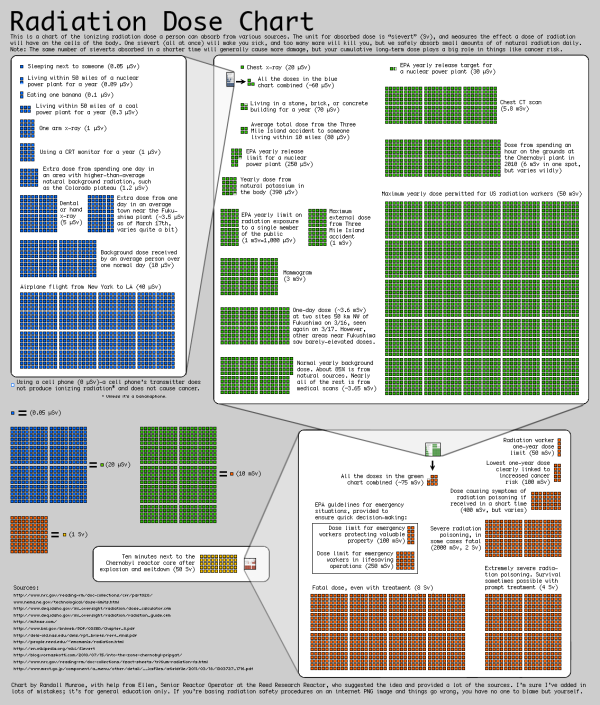
The Radiation Dose Chart from XKCD.com is very cool.  Not part of the usual stream of comics, this is a more scientific chart from Randall Monroe helping to visualize the facts about radiation exposure.

There’s a lot of discussion of radiation from the Fukushima plants, along with comparisons to Three Mile Island and Chernobyl. Radiation levels are often described as “<X> times the normal level” or “<Y>% over the legal limit,” which can be pretty confusing.

Ellen, a friend of mine who’s a student at Reed and Senior Reactor Operator at the Reed Research Reactor, has been spending the last few days answering questions about radiation dosage virtually nonstop (I’ve actually seen her interrupt them with “brb, reactor”). She suggested a chart might help put different amounts of radiation into perspective, and so with her help, I put one together.

I’m not an expert in radiation and I’m sure I’ve got a lot of mistakes in here, but there’s so much wild misinformation out there that I figured a broad comparison of different types of dosages might be good anyway. I don’t include too much about the Fukushima reactor because the situation seems to be changing by the hour, but I hope the chart provides some helpful context.

Found on Bad Astronomy, Daring Fireball, FlowingData and VizWorld.

Monday
Jan172011

The Sequel Map - Is Part II Ever Better than the Original?


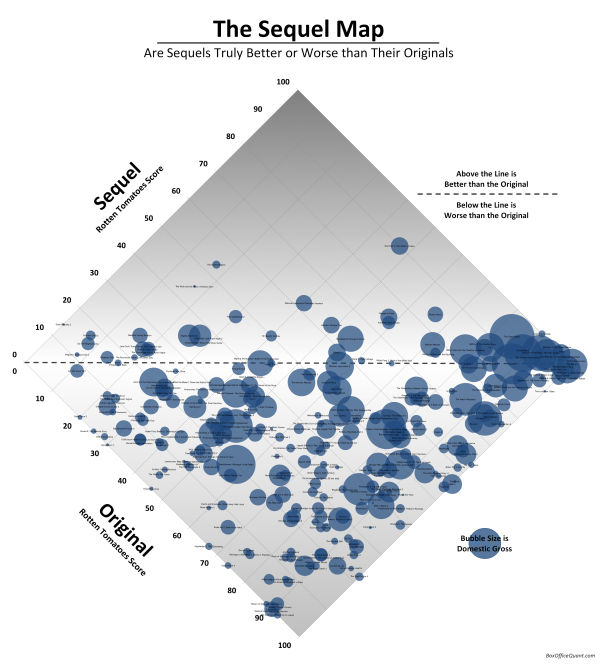
The Sequel Map, from BoxOfficeQuant.com is a cool chart of movie sequels showing how they compared to the original.  The location is based on the RottenTomatoes.com scores of the original and the sequel being plotted.  If the scores are the same, the movie would be exactly on the line, and any sequel with a score higher than the original is above the line.  The sizes of the bubbles represent the total box office receipts.

As evidence, all sequels with Rotten Tomatoes scores have been categorized below, with the originals’ scores on the X-axis, and the sequels’ scores on the Y. Films at the center line are sequels with the exact rating as the original; films above are sequels that have surpassed the original; films below, ones that fared worse.

Notes: Categorization of sequels is sometimes more art than science, so I’ve had to follow a few rules: I’ve only included the second film in any series, never third or following films. I haven’t included remakes or “reboots,” and I’m only presenting films which opened (at some time) in the US and have Rotten Tomatoes ratings.

And finally, it’s worth noting that the only two film/sequel combos to both score 100%, are the first two Toy Storys and the French films Jean de Florette / Manon des Sources.

Rotten Tomatoes ratings from RottenTomatoes.com. US Gross from www.the-numbers.com

I especially like turning the chart 45°, which puts the best score possible for a sequel to improve on the original at the top center of the chart.  If both the original and the sequel scored high, the bubbles are located towards the right instead of the top.  I’ve done this with a number of 2x2 quadrant charts for clients.

So, according to the chart, Star Trek II: The Wrath of Khan was the best sequel improvement over the original, and I would have to agree.

I’d love to see a version that plots the box office receipts on the X and Y axes so that it would show the instances where the sequel made more money than the original.  You could see more of the financial incentive behind making sequels, even if they’re generally rated lower than the original.

Found on VizWorld.com

Monday
Apr262010

Cooking for Engineers...recipe infographics! (and interview)

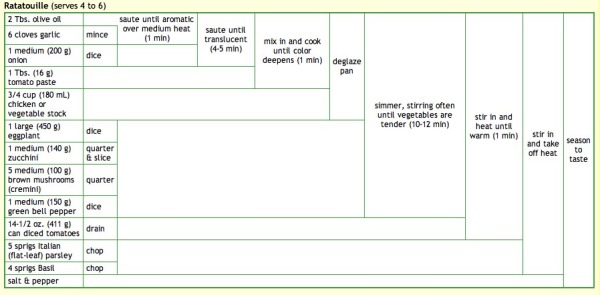
Michael Chu has been running the CookingForEngineers.com site for 6 years now, and he developed this infographic recipe table using HTML tables.  His recipe table is essentially a timeline of making that particular recipe, but also lists every ingredient, ingredient amounts, recipe instructions and the points in time they are added to the dish.  All in one, compact visual image.  Outstanding!

Michael also demonstrates each step of the recipes with pictures so you know what it should look like when you attempt the recipe.

Michael was also nice enough to answer a few interview questions I sent him:

Cool Infographics: What software applications do you use for the recipe graphics?

Michael: I use a text editor and write the HTML for the recipe tables by hand.  For the graphics used on my business cards and T-shirts and other merchandise, I copy and paste the browser rendered table into excel for some slight tweaking. Then I copy and paste into Adobe Illustrator for final adjustments.

Cool Infographics: What was your inspiration behind developing the recipe graphic?

Michael: I developed it on my own based on a shorthand notation that used for years to write down recipes on Post-It notes involving curly braces and actions scrawled on the side.

Cool Infographics: Have there been any recipes that have been particularly difficult to visualize?

Michael: Some recipes, especially ones involving discarding part of the ingredients and reintroducing ingredients at various points in time do not lend themselves to the recipe summary table.

Cool Infographics: What’s your most complicated recipe graphic?

Michael: It’s hard to determine… most recipes don’t come out all that complicated. The real trouble is that sometimes browsers act funny and start sticking in vertical or horizontal lines where they do not belong.

http://www.cookingforengineers.com/recipe/227/Ratatouille

http://www.cookingforengineers.com/recipe/60/The-Classic-Tiramisu-original-recipe


Cool Infographics: I keep calling it a recipe graphic, what do you call that visual style?

Michael: I call them either recipe summary tables or Tabular Recipe Notation (TRN).

Cool Infographics: Have you seen anyone else start to use that type of visual graphic for recipes?

Michael: After I started using it, I have had a few people email asking permission to use the format for their own recipe books, etc.

Cool Infographics: How long have you been running Cooking for Engineers, and have you been using that recipe graphic the whole time?

Michael: Cooking For Engineers has been up and running since June 2004 and we’ve been using the table from day one. Incidentally, the first recipe posted is this one:

http://www.cookingforengineers.com/recipe/53/Salsa-Cruda
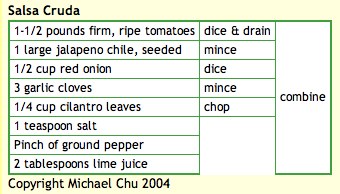
 

Check out all of Michaels’ recipes at CookingForEngineers.com

Page 1 2 3