About
Randy Krum
President of InfoNewt.
Data Visualization and Infographic Design

Infographic Design

Infographics Design | Presentations
Consulting | Data Visualizations

DFW DataViz Meetup

Join the DFW Data Visualization and Infographics Meetup Group if you're in the Dallas/Fort Worth area!

Search the Cool Infographics site

Custom Search

Subscriptions:


Feedburner

The Cool Infographics® Gallery:

How to add the
Cool Infographics button to your:

Cool Infographics iOS icon

- iPhone
- iPad
- iPod Touch


Read on Flipboard for iPad and iPhone

Featured in the Tech & Science category

Flipboard icon

Twitter Feed
From the Bookstore

Caffeine Poster

The Caffeine Poster infographic

Entries in charts (150)

Wednesday
Jul092008

The Map of Scientific Paradigms


One of the projects from Information Esthetics, the Map of Scientific Paradigms by Kevin Boyack, Dick Klavans and W. Bradford Paley shows how scientific papers in different fields are connected through their citations.

As to what the image depicts, it was constructed by sorting roughly 800,000 scientific papers into 776 different scientific paradigms (shown as red and blue circular nodes) based on how often the papers were cited together by authors of other papers. Links (curved lines) were made between the paradigms that shared common members, then treated as rubber bands, holding similar paradigms closer to one another when a physical simulation forced them all apart: thus the layout derives directly from the data. Larger paradigms have more papers. Labels list common words unique to each paradigm.

 Thanks for sending in the link Alwyn!

Thursday
Jul032008

Top 10 UK Brands 2007 Visualisation


Top 10 UK Brands 2007 Visualisation, originally uploaded by visual think map.
Inspired by the infographic "Who Owns the Car Companies" that I originally posted about in October 2007, Chris Watson, from Visualthinkmap.blogspot.com, has created a cool infographic showing the owners for some of the top brands in the UK.

Great job Chris!

Wednesday
Jun252008

The Summer of Pool Shows


Another page of quirky charts from Andrew Kuo that I came across from October 2007. These try to represent information about the 2007 summer's series of concerts at Brooklyn's McCarren pool.

Found on CoolHunting.com

Tuesday
Jun242008

Pessimist's Guide to Summer Festivals

A full page of different chart styles by Andrew Kuo on nytimes.com. A number of Andrew's quirky charts have been showing up in the NY Times lately.

When he was 15, in 1992, the artist Andrew Kuo tagged along with his older brother to the second year of Lollapalooza in Stanhope, N.J. It was Mr. Kuo’s first summer festival, and he was so excited that he bought the albums by most of the bands on the bill beforehand. Then, halfway through the show, after sets from Pearl Jam (his favorite) and the Jesus and Mary Chain, “I didn’t want to be there anymore,” he said. “I felt like I was being held captive.” Thus began his lifelong ambivalence toward outdoor festivals. “When you finally get to the picnic, there’s ants everywhere,” Mr. Kuo said. Here’s a pessimist’s guide to the summer festival season, which kicks into high gear with the Bonnaroo Music and Arts Festival on Thursday in Manchester, Tenn. Mr. Kuo will be home napping.
Thanks Sandhya!

Monday
Jun162008

The Cost of Gadgets


From Wired.com, this is really a 3-dimensional chart. I liked it because there are very few 3D charts that actually portray 3 dimensions of data. (This is actually 4D if you include the different products as a dimension) Usually 3D charts are just bad use of chart styles from PowerPoint. I also like the perspective from above. Although unusual, it helps to see the whole chart.

Friday
Jun132008

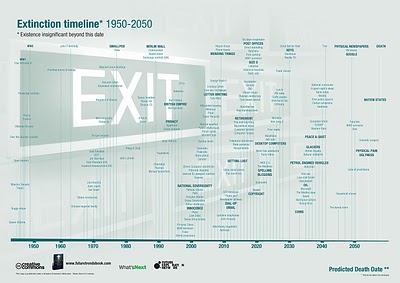
The Extinction Timeline 1950-2050


Richard Dawson from What's Next (www.nowandnext.com) created the Extinction Timeline with his predictions of what products and services will disappear in the next 50 years. Also available as a PDF here. Here are a few highlights:

  • 2018 DVDs
  • 2019 Libraries
  • 2025 Desktop computers
  • 2030 Reality TV (why so long?!?)
  • 2037 Glaciers
  • 2049 Physical Newspapers
Found on Digg.com

Thursday
Jun122008

WarCraft III DotA Poster


Created by Alwyn B., this hierarchical tree shows the complex Hero Item recipes for the WarCraft III MOD "Defense of the Ancients". As a fan and a player of the game, Alwyn painstakingly created his own infographic and then posted in on the Internet to share with other players. This makes a fantastic poster!

More than just the item combinations, the poster shows:

  • Shows the basic items and how to combine them to form better items.
  • Shows where to buy them, and for how much.
  • Mini Map that shows shop locations
  • Shop Item Layouts
When I looked today, this chart had been viewed over 100,000 times. Great job Alwyn, and thanks for sharing.

Wednesday
Jun112008

Democratic Party Voting Margins


New interactive infographic by Shan Carter and Amanda Cox on nytimes.com that shows the voter margins between Democratic candidates Hilary Clinton and Barrak Obama. These are based on exit poll data.


Choose any of the sorting criteria on the bottom, and then you can see specific data about any particular state by hovering the mouse over the blocks. The top chart shows how Men voted overall, and the second chart is how voters with No College Education voted.

Thanks Les for sending in the link!

Wednesday
May282008

The world as you've never seen it before


Check out WorldMapper! Above is a map of the world based on true Land Mass, but with WorldMapper, you can adjust the size of the countries based on whatever data you are trying to convey.

This is the world map based on Total Population:


This is the world map based on Total Computer Exports:


Alisa Miller, head of Public Radio International, talks about why -- though we want to know more about the world than ever -- the US news media is actually showing less. She uses WorldMapper to communicate her point about the state of today's news in the US.

Monday
May262008

In the Shadow of Foreclosures


Great graphic from NYTimes.com showing the subprime mortgage foreclosures as a percentage of all subprime mortgages by geographic region of the country.