About
Randy Krum
President of InfoNewt.
Data Visualization and Infographic Design

Infographic Design

Infographics Design | Presentations
Consulting | Data Visualizations

DFW DataViz Meetup

Join the DFW Data Visualization and Infographics Meetup Group if you're in the Dallas/Fort Worth area!

Search the Cool Infographics site

Custom Search

Subscriptions:


Feedburner

The Cool Infographics® Gallery:

How to add the
Cool Infographics button to your:

Cool Infographics iOS icon

- iPhone
- iPad
- iPod Touch


Read on Flipboard for iPad and iPhone

Featured in the Tech & Science category

Flipboard icon

Twitter Feed
From the Bookstore

Caffeine Poster

The Caffeine Poster infographic

Entries in charts (150)

Thursday
Oct092008

Watercube, The Book


Watercube, is a new book by Ethel Baraona Pohl.  The book is about the National Aquatics Centre built in Beijing for the 2008 Olympics, and has some cool infographics inside.  Some of the graphics were contributed by architect César Reyes Nájera.  A review of the book can be found here on www.v2com.biz
WATERCUBE: The Book is a complete monographic publication about the National Swimming Center for the Beijing Olympics 2008. With an exhaustive description about the Watercube we present a detailed study of the project. The book makes an holistic approach to the project that starts with a brief description of urban and social changes that China has been experienced in the last decade. These facts have encouraged the construction boom that made possible these kind of projects occur in cities like Beijing.

 
This page compared the amount of steel used to built the Watercube to some of the most well known buildings around the world.
This page shows a comparison to the same set of buildings around the world, but shows the tons of CO2 produced due to the steel used in their construction.


This page is one of the years of the timeline leading up to the construction of the Watercube.

Here you can buy Watercube, by Ethel Baraona Pohl, on Amazon.com.

Special thanks to Ethel for sharing the images from her book, and allowing me to post them on Cool Infographics!

Tuesday
Oct072008

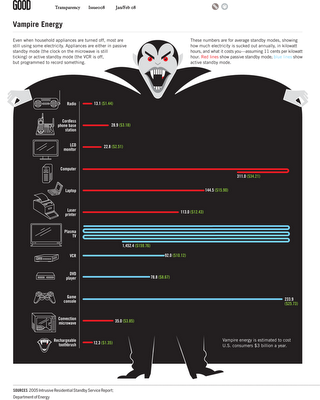
Vampire Energy infographic video & chart

From GOOD magazine, they created an infographic video about Vampire Energy, all of the energy used by electronics in your house while you are not actively using them.  The chart itself from the magazine is fairly simple chart, but I really like it.  It's effective getting the message across with simple graphics.

Tuesday
Sep302008

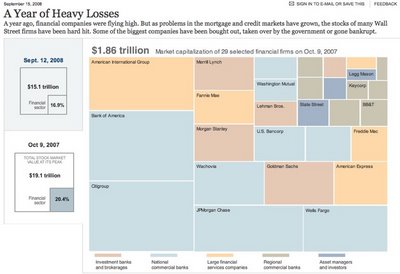
A Year of Heavy Loses


Over at Nytimes.com, they have a good treemap showing the drop in market capitalization over the past year of most of the big financial firms on Wall Street.  It's a little bit interactive, in that when you hover your mouse over any box, you will see more details.

Found on infosthetics.com

Monday
Sep222008

Probabilistic Stock Market Forecast


I won't claim to understand or attempt to explain the math behind the investolution.com charts that predict the overall stock market for the next 40 days.
This page contains the prediction for S&P 500 Index minimum and maximum daily closing prices over the next 40 trading days.  

It is predicted that S&P 500 Index will not close under 1,178 and over 1,295 between the dates September 19, 2008 and November 14, 2008. This prediction method was accurate for 71.0% and 95.0% of the cases (for minimum and maximum predictions, respectively) within an error margin of +-5% in the past. 

Thanks Andrew for sending in the link.

Saturday
Aug232008

Olympic Wrap-Up


To complete the week of Olympic Infographics from the NYTimes.com, they have created a page to summarize all of the infographics they created.  They've been adding to it every day, so it won't actually be complete until the Olympics are over.

Tuesday
Aug192008

Olympic History of World Records


The History of World Records from NYTimes.com shows how the world record in a number of Summer Olympic events has progressively been beaten over the last 100 years.  In this chart, the Men's 100m Freestyle record was beaten three times this year improving the world record by 0.45 seconds.  Similar events are all charted together, so you can see other freestyle events on the same chart.

Friday
Aug152008

National Debt and the Presidents

First, I'm not pushing any particular political agenda.  There's considerable debate around this chart, so I don't want to start any arguments.  The debate isn't around the validity of the data, but about how it's being presented.  The information is freely available from the U.S. Department of the Treasury and the Bureau of the Public Debt.

Second, I like that this chart takes a simple bar chart and adds a few more layers of information.  At its root, this is a timeline of the increase in the national debt based on the federal budget by year.  Then layered on top of that are the presidents in office that year, some color coding, the political party controlling the White House and highlights for record years.

Third, just to share the reasons for the debate.  This is a great example of data being visualized with a specific agenda in mind.  Obviously, this is a chart framed to make Republicans look bad, and Democrats look good.  The debate centers around a few issues like programs started by one President will carry into the term of another President and more importantly that the political party controlling Congress actually has more impact on the federal budget than the President does.

Wednesday
Aug132008

BBC World Food Prices

The BBC online has a site dedicated to charting food prices around the world called : The cost of food: Facts and figures.  Mostly simple charts, but they've found a handful of really good information.  They could make these prettier, but they get the message across.  Each chart tells a simple story.

Wednesday
Aug062008

Visual Baby Name Trends site

NameTrends.net is a fantastic interactive site that charts and maps the popularity of baby names over the last century in the U.S.  You can look at the most popular names, or search for specific names to see their results.  The chart above shows the top 20 baby names from the 2000's decade (10 boys and 10 girls).  You can see that those names also had some popularity at the end of the 19th century.

The site also allows you to map the name popularity by state.  The slider across the top allows you to see the geographic distribution by year.

Found on Information Aesthetics.

Monday
Jul212008

When are you at risk online?

From the Mozilla website, and obviously a part of their sales pitch.  I picked up that the calendar arrangement of the squares is in fact correct for 2006.  Its getting the small things right that help make good infographics.

An independent study shows that, in 2006, IE users were vulnerable to online threats 78% of the time. Firefox users? Only 2%.

“At risk” defined as publicly available exploits with no patch. Source: “Internet Explorer users Unsafe for 284 Days in 2006” Brian Krebs, Washington Post, 1/4/2007