About
Randy Krum
President of InfoNewt.
Data Visualization and Infographic Design

Infographic Design

Infographics Design | Presentations
Consulting | Data Visualizations

DFW DataViz Meetup

Join the DFW Data Visualization and Infographics Meetup Group if you're in the Dallas/Fort Worth area!

Search the Cool Infographics site

Custom Search

Subscriptions:


Feedburner

The Cool Infographics® Gallery:

How to add the
Cool Infographics button to your:

Cool Infographics iOS icon

- iPhone
- iPad
- iPod Touch


Read on Flipboard for iPad and iPhone

Featured in the Tech & Science category

Flipboard icon

Twitter Feed
From the Bookstore

Caffeine Poster

The Caffeine Poster infographic

Entries in design (479)

Wednesday
Jan022013

Comparing NFL Stadium Screens

Comparing NFL Stadium Screens infographic

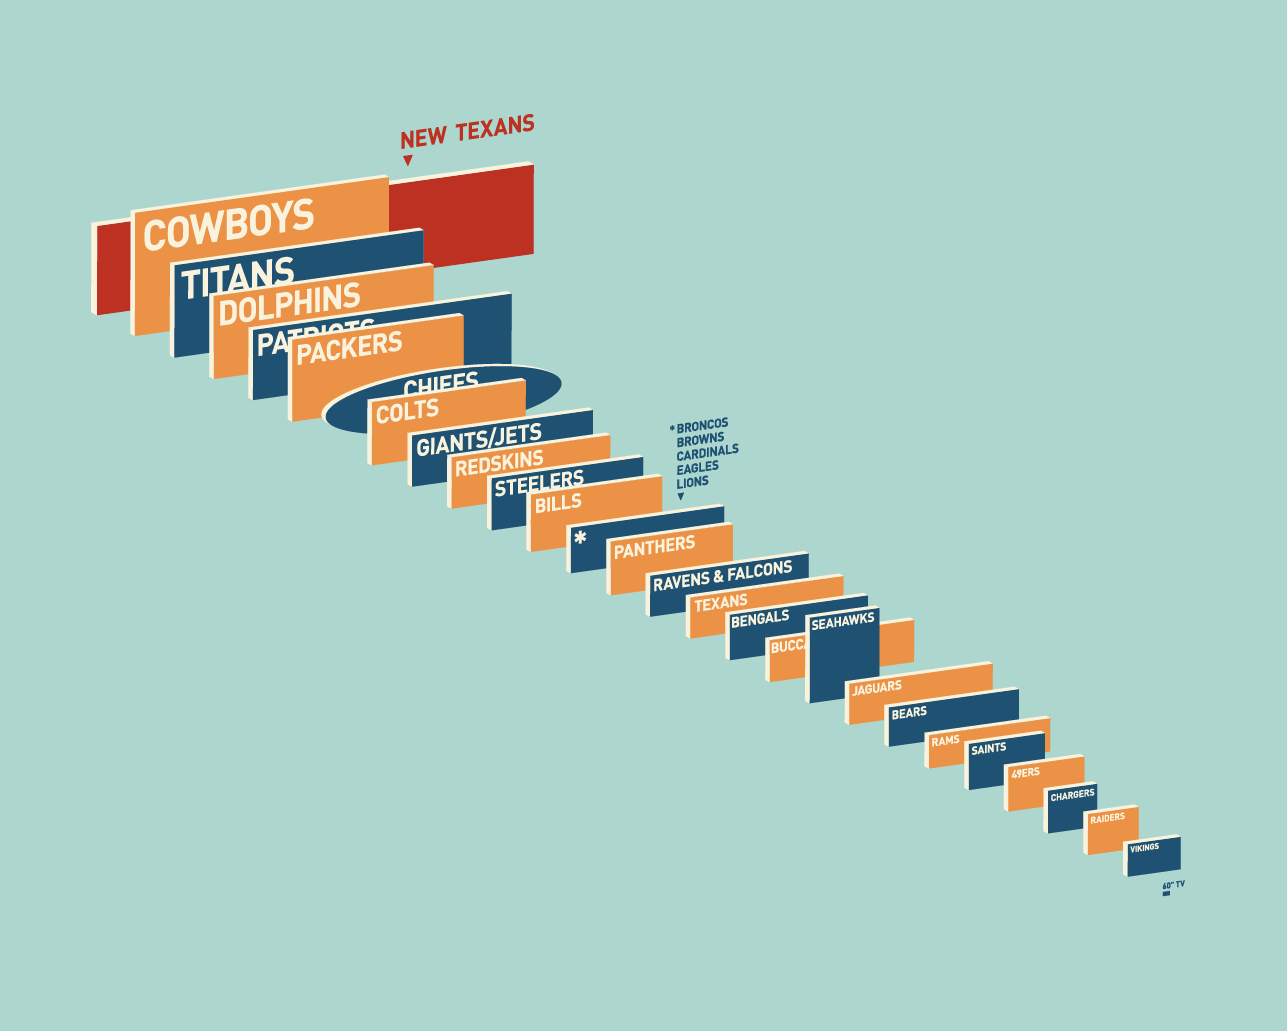
This visual comparison of NFL Video Screens was uploaded by reddit user dbeat after the announcement of the new video display being built for the Houston Texans’ Reliant Stadium.

I would have liked to see a link to the data behind all of the screen sizes, but this visual representation does a great job of telling one story really well.  The readers can easily find their favorite team, and understand how they stack up.

Found on FlowingData and Deadspin

Friday
Dec212012

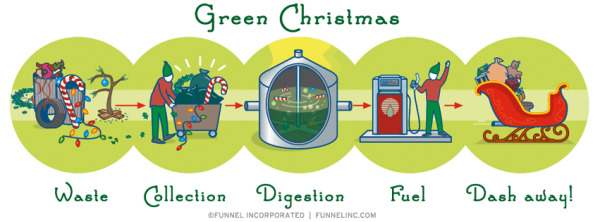
Infographic Holiday Cards 2012

Infographic Holiday Cards 2012


This is a limited time offer!  

Funnel Incorporated is offering a FREE 4-pack of infographic holiday cards to everyone that submits a request (while supplies last) through a giveaway on Facebook.  You must request your free pack of cards through the Facebook page by Noon CT on Saturday December 22 (Tomorrow!).

U.S. and Canada only, but anyone can download the infographic holiday themed wallpaper designs from the Funnel website at http://www.funnelinc.com/holiday

Thursday
Dec132012

The New Christmas Tradition...Artificial Christmas Trees!

The New Christmas Tradition...Artificial Christmas Trees! infographic

Wow!  Apparently the U.S. has completely converted over to artificial Christmas trees while no one was looking!  The Redefining Christmas Traditions infographic from Tree Classics is a summary of findings from two Nielsen studies in both 2011 and 2012 and information from the American Christmas Tree Association.

Every Christmas tradition begins somewhere, and those of us who follow Christmas tree trends know that more and more families are building their holiday traditions around artificial Christmas trees. Find out who’s buying artificial, where they live, and why more and more people are choosing artificial in our infographic of real vs fake artificial Christmas tree facts. If you’re thinking of starting a family tradition of your own, consider buying a Pre Lit Christmas Tree from Tree Classics and start making holiday memories that will last year after year!

The design does a great job of jumping to the main point right away.  A huge majority of homes in the U.S. use artificial Christmas trees for the holidays.  This is the Key Message of the design, and it communicates that fact in less than 5 seconds to the readers.  So even if they don’t read the rest of the design, they still understand the main point.  Also, what makes a popular infographic is bringing to light some surprising, unexpected information to the readers.

The shear magnitude of the number was surprising to me, and I think it will be to a lot of readers.  We see real live Christmas trees being the symbol of home and family traditions in the media, but the reality is that 3.5x more homes display artificial trees than live ones.

All of the important design elements are there.  Focused topic, clear data visualizations to support the Key Message, respectable sources cited, copyright statement and the URL to the original infographic so readers can find the full-size version.

Designed by InfoNewt with designer Jeremy Yingling

Tuesday
Dec112012

The Ultimate Guide to Secret Santa

The Ultimate Guide to Secret Santa infographic

The Ultimate Guide to Secret Santa is a fun design for Christmas from MoneySupermarket.com in the UK (so the currency amounts are in British Pounds).  This office traditional strikes fear into many employees that fear getting the gift wrong.

Oh, the joys of working in an office at Christmas time.  Festive decorations, the office party and of course the exchange of “Secret Santa” presents make corporate Yuletide a truly eventful experience. 

Secret Santa involves the anonymous exchange of cheap gifts at Christmas time, typically between office workers.  It is a fun test of your resourcefulness and innovation as you endeavour to buy a present that your colleague will either love, or will find ironically hilarious.  If you go for the humorous option however, it is important to ensure that your colleague will understand and appreciate the joke!

If you are struggling for inspiration this year, hopefully our Secret Santa infographic will provide some ideas.  If you’d rather not play this year and make some savings on your Christmas present budget, we still think you’ll enjoy what we’ve come up with…

The first thing you’ll notice about this design is that it’s an animated GIF file.  A flashback to 90’s web design, this has been pretty tastefully done to only animate the characters eyes to blink and the title text.  You don’t see this in infographic design very often, and I think it was very well done here.

Both a copyright statement and the URL to the original infographic landing page should have been included in the footer space.

Thanks to Paul for sending in the link!


Monday
Dec102012

The Christmas Bugs: Adopt-A-Bug this holiday

The Christmas Bugs infographic

The Christmas Bugs infographic from Adopt-A-Bug and ChristmasTreeMarket.com helps raise awareness of the plight many bugs face as the weather begins to get cold.  This Christmas bring some tiny friends in from the cold and into your warm home when you buy a live Christmas tree for the holidays!

Adopt-A-Bug this year for the holidays!  Bringing a live tree into your home is like inviting the great outdoors into your living room.  Here are a few new friends you can make that will decorate your tree and light up your life, plus some statistics to share over your eggnog.

The design combines facts and statistics about the different types of bugs that actually live in the trees that most people use as Christmas trees.  I love the fun approach to raise awareness that there is a real risk to bringing a live Christmas tree into your home.  Check out the Adopt-A-Bug site to see all of the party bugs that you can save this Winter by bringing them into your home!

Designed by InfoNewt with designer Ray Vella, this infographic gets all the key design points right.  Nice 3-part story throughout the design, including a clear call-to-action at the end.  Copyright statement, clear sources and the URL to the infographic landing site.

Friday
Dec072012

Nobel Prizes and Laureates Timeline Visualization

Nobel Prizes and Laureates Timeline Visualization 

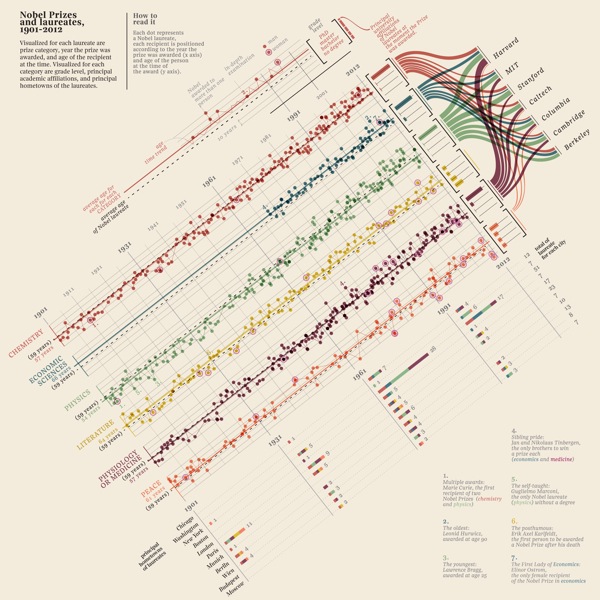
Nobel Prizes and Laureates is great visualization from the Milanese design firm Accurat.  From 1901-2012 this information design breaks down the winners by category, age, principal university affiliates and even hometowns.

The high-resolution version is available on Visualizing.org

The visualization explores Nobel Prizes and Laureates from 1901 to 2012 analyzing the age of recipients at the time prices were awarded, average age evolution through time and distribution among categories, grade level, main affiliation universities and principal hometowns of the laureates.

Designed as a part of an ongoing series for the Milanese newspaper Corrierre della Sera, La Lettura is a culture supplement.  You can see this design and the rest of the series in the collection on Visualizing.org.

The timeline takes a lot of information, and makes it easy to understand for the readers.  I especially appreciate the transition from line chart of ages to the bar chart of education grade levels to the sankey diagram of universities at the right end of the timeline.  Beautifully done.

Each dot represents a Nobel laureate, each recipient is positioned according to the year the prize was awarded (x axis) and age of the person at the time of the award (y axis).

Found on FastCoDesign

Thursday
Dec062012

MHPM's Infographic CSR (Corporate Sustainability Report)

MHPM's Infographic CSR (Corporate Sustainability Report)

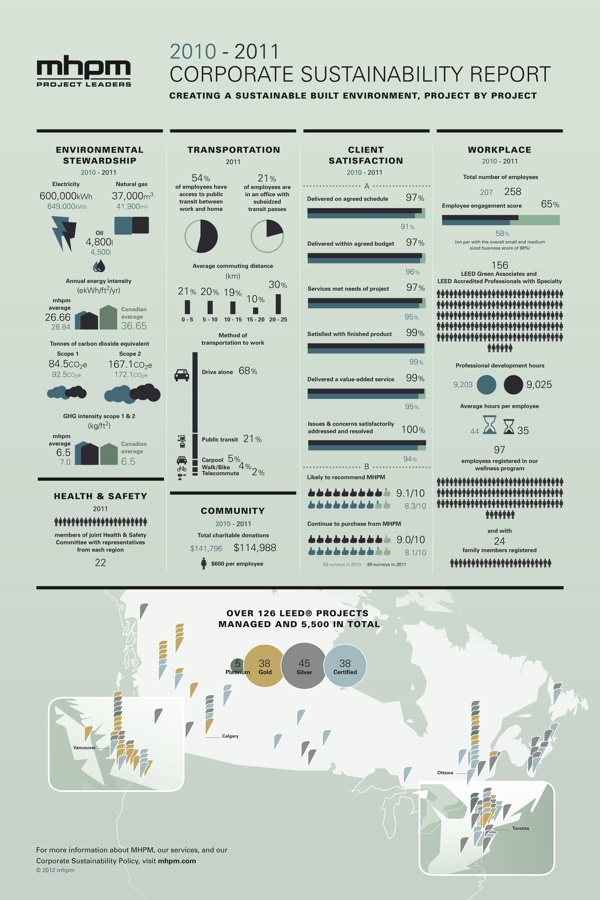
MHPM Project Managers has taken a different approach with the release their first CSR (Corporate Sustainability Report).  Instead of the normal text report that other companies release, MHPM created an infographic poster with all of their sustainability information.  It serves as a great example to their clients of how even CSR data can be designed in an engaging way.

MHPM Project Leaders passed a milestone towards integrating sustainable practices into its business operations today, with the release of its first annual corporate sustainability report.

MHPM’s corporate sustainability report evaluates MHPM’s impact on the environment and the community, its transportation practices and workplace policies. The findings reveal areas for improvement and provide a benchmark against which to measure future performance.

Designed by InfoNewt, this poster was printed at 24” x 36” by MHPM and is also available online on the Corporate Sustainability Report section of their website.  The front side of the post visualizes all of the data, and puts most of it into context by comparing to prior year results.  The back side of the design includes all of the required text, which keeps the front side less cluttered and easy to read.  The entire design is inspired by the Global Reporting Initiative’s guidelines.

This is a fantastic use of infographic design principles!  The full size, high-resolution poster is available as a PDF download from the CSR page.

Thursday
Nov292012

40 Must-See Modern Marketing Charts

40 Must-See Modern Marketing Charts

Eloqua has teamed up with infographic design firm JESS3 again to create Modern Marketing Insights, a series of 40 infographics using big data analysis that can help marketers anywhere.

Did you know that dynamic content can improve conversions by 50%? Or that emails sent on a Saturday get the highest number of click-throughs? Were you aware that when influencers share your content on social it can result in a dramatic increase in traffic and conversions?

That’s why we produce a chart every week that modern marketers can easily learn from and use. And it’s why we’ve gone back with our friends at JESS3 to reproduce the most indispensable data points, coming up with 40 understandable, actionable charts. Wide-ranging in scope, the charts hit the most important topics hitting marketers today – from social media to email.

With that in mind, we offer the charts in two forms. You can head over to the custom-made website and explore the charts by topic, getting to the data that matters most to you. Or you can download all 40 charts in a free eBook. It’s well worth keeping near your desk.


40 Must-See Modern Marketing Charts

Even those each of these is only exploring one data set, these are actually good infographic designs that follow some important design rules.

First, each one tells one story really well, and the Key Message is easy to understand.  Most readers of infographics are only looking at a design for less than 5 seconds, and a good infographic design will successfully communicate their primary message in that short time.

Second, each design is easy to share.  Each of the 40 designs has it’s own landing page on Eloqua’s site, and their own dedicated social media sharing buttons.  This is fantastic for SEO, and much easier to utilize the information for users.  So, if you’re interested in a data set about email to customers, you can share that information with colleagues without also sharing a data set about Pinterest.

You can read more about the series on the Eloqua blog.


40 Must-See Modern Marketing Charts

A couple things I do think are missing from each design that would help Eloqua in the future.

  • Since these are being shared individually, the URL back to the original on Eloqua site should be included in the image.
  • A copyright statement to clarify usage rights.  Does everyone have permission from Eloqua to include these charts and data in their own presentations?
  • Much of the data is proprietary to Eloqua, so the raw data behind the designs isn’t available to the public.  It would be great for Eloqua to make the data behind each chart available publicly (like in a Google Docs spreadsheet) since they are making the data public in the charts.
  • A conclusion.  I think the subtle implication is that companies should call Eloqua for help using this information, but a short statement suggesting what action companies should take based on each data set would close each design nicely.

Thanks to Jarred for sending in the link!

Wednesday
Nov282012

State of Graphic Design

State of Graphic Design infographic

Smartpress surveyed some of the best and most talented graphic designers and put the results into the State of Graphic Design infographic.  They include tips like “How to learn the field” and “Top 5 states for graphic designer employment” that could be crucial for newbies to the field.

Welcome to the 2012 edition of the State of Graphic Design!

Smartpress.com conducted a survey to aggregate the opinion of dozens of the best and most-talented graphic designers in the industry. The results were turned into a success factors/guide document in form of an infographic. This year the survey included more than 40 industry experts that have 5+ years of experience.

Thanks to Harrison for sending in the link!

Tuesday
Nov272012

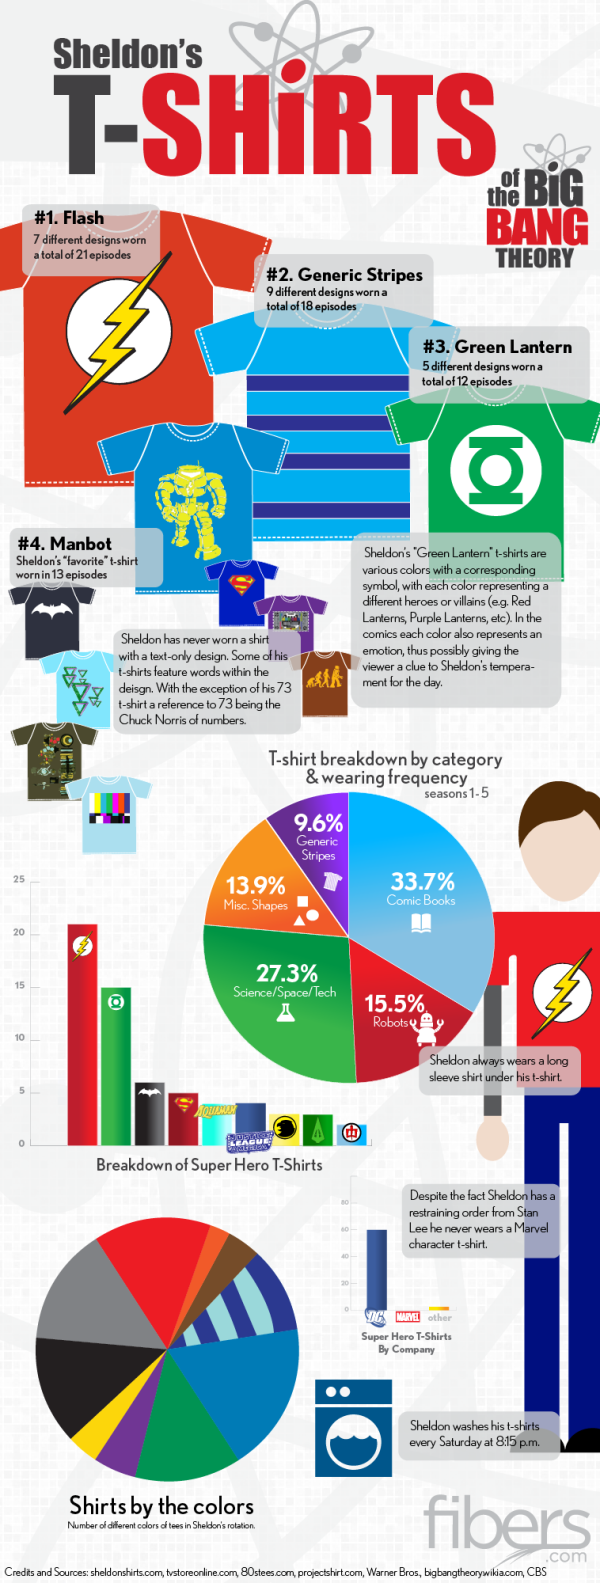
Sheldon's T-Shirts of The Big Bang Theory

Sheldon's T-Shirts of The Big Bang Theory infographic

If you have seen the comedy show The Big Bang Theory, then you know Sheldon…. If you haven’t seen it, go watch it and get back to us.  Have you ever noticed his wardrobe?  The Sheldon’s T-Shirts infographic from fibers.com tells you his favorite shirts, how often he wears his shirts, and even what colors he wears the most! 

Graphs, Charts and illustrated T-Shirts with correlating sizes to wearing frequency - would there be any other way to visualize Sheldon Cooper’s t-shirt collection from The Big Bang Theory? We think not.

Big thanks to Sheldon’s Shirts where we got most of the data for this graphic. You can find a lot of Sheldon’s Shirts for purchase on the following websites:

This is just a fun infographic that uses some data visualization to appeal to fans of the show.  Good design using publicly available data that has been complied in an engaging way.

The charts actually very well done.  Charts are color-coded to match the data.  Icons are included on the bars or in the pie slices, so no chart legends are needed.  This makes the data faster and easier to understand.

Found on Fibers.com