About
Randy Krum
President of InfoNewt.
Data Visualization and Infographic Design

Infographic Design

Infographics Design | Presentations
Consulting | Data Visualizations

DFW DataViz Meetup

Join the DFW Data Visualization and Infographics Meetup Group if you're in the Dallas/Fort Worth area!

Search the Cool Infographics site

Custom Search

Subscriptions:


Feedburner

The Cool Infographics® Gallery:

How to add the
Cool Infographics button to your:

Cool Infographics iOS icon

- iPhone
- iPad
- iPod Touch


Read on Flipboard for iPad and iPhone

Featured in the Tech & Science category

Flipboard icon

Twitter Feed
From the Bookstore

Caffeine Poster

The Caffeine Poster infographic

Entries in design (479)

Monday
Oct222012

The Sage Hill Difference marketing infographic & interview

The Sage Hill Difference marketing infographic & interview

The Sage Hill School has created an infographic as a marketing piece showing many of the different stats about the school’s history and performance.  The Sage Hill Difference has been used as a printed handout, a 7-foot retractable banner, a PDF available for download and the JPG image file online.  The design is used to educate and inform prospective families, parents, students and the general public.
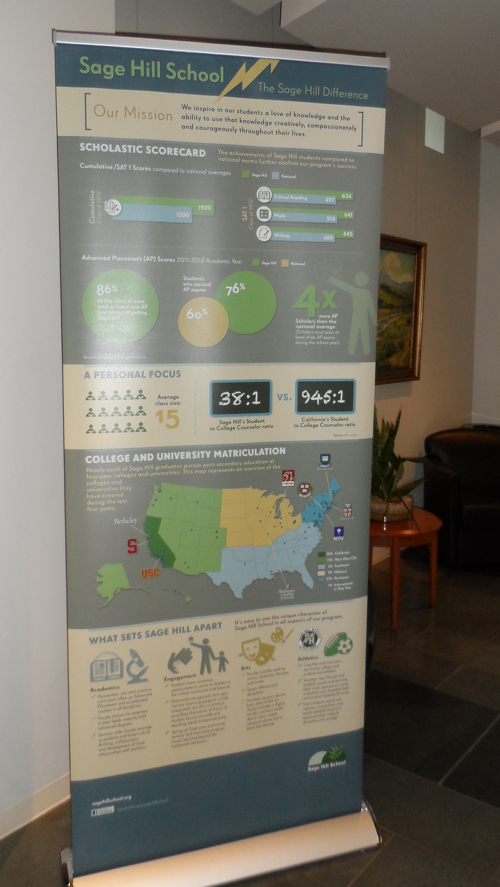
 

The Sage Difference: 7-foot retractable banner

I asked Torrey Olins, the Director of Communications and Marketing at Sage Hill, some questions about designing and using the infographic as a marketing tool:

Cool Infographics: What software applications were used to help analyze the data and create the design?

Torrey Olins: The piece was created using InDesign. The data was collected and analyzed through a combination of resources from Sage Hill School and our advertising firm, O’leary and Partners (www.adagency.com)  The piece did not require any software for analysis of data.

Cool Infographics: Who designed the infographic?

Torrey Olins: The design of the infographic was a collaboration between myself O’leary and Partners. About six months ago, I came up with the idea of creating an infographic for the school’s marketing efforts in our fall 2012 admission season, and in fact, sent my account manager and her assistant links to coolinfographics.com for inspiration. We were unable to find any other high school that had created an infographic for marketing, so we ended up using elements from a variety of different sources. For example, the school history portion of the infographic was inspired by an infographic created to celebrate the history of a small city.

Because O’leary and Partners has been creating print and digital media for Sage Hill School for several years, they were able to apply our design look and feel (color palate, fonts, etc.) to this piece so that it integrates nicely with our other school communications, while also going in an entirely new direction. I did not want this piece to look like a “one off” and I was pleased that O’leary accomplished my goal of creating an infographic that maintains continuity with our brand.

Cool Infographics: Would you describe the different formats you published the infographic?

Torrey Olins: The infographic was published as an 8.5” x 25” folded print piece that we hand out to prospective students and parents at high school fairs, our Admission Open House and other campus events. We also have a jpg and pdf copy of the infographic on our website (www.sagehillschool.org) and have published it on our Facebook (www.facebook.com/sagehillschool) and Pinterest accounts (www.pinterest.com/sagehillschool). We also reproduced the infographic on two large (7’x3’) retractable banners that we can bring to off campus events or use around campus (we currently have one in our lobby for visitors to see while they are waiting for appointments.)

Cool Infographics: How has the use of the infographic and social media impacted your marketing and recruiting process?

Torrey Olins: Sage Hill School is Orange County, California’s premier independent, coed, nonsectarian high school. The school was founded in 2000 and currently enrolls 466 students in grades 9-12.  Because Sage Hill School is located in a community that does not have as long of a history with independent schools as with the public school system, it is important for us to highlight the differentiators that make Sage Hill School the finest college preparatory option in our area. The infographic is an effective way to communicate the value of a Sage Hill education to the parent who is deciding whether to send a child to public school or pay tuition for Sage Hill School.

The infographic format met my needs for a fresh approach to demonstrate the achievements and differentiators of Sage Hill School to prospective families, as well as reinforcing the value of the school for our currently enrolled families. We are very excited that Sage Hill School is one of (or possibly the first) high schools to utilize the infographic format for marketing in the 2012-2013 admission season!

The recruiting season for independent schools typically begins in October and will last until admission decisions are announced and families sign contracts in the spring. Thus, it is quite early in the process and unfortunately,  it is too soon for us to speak to increases in inquiries/ applications as a result of the infographic or other social media efforts.

Cool Infographics: What has been the reaction and feedback to the infographic?

Torrey Olins: Let’s face it, facts and stats about schools can be extremely dry. For families who are considering a variety of different high school options, numbers and figures tend to run together. Thus far, both current and prospective families have indicated that the information in the infographic is presented in a way that is interesting, fun and memorable.

As a school in our second decade, Sage Hill has established a reputation for innovation in our educational program; this year we are pleased to educate families about Sage Hill School through the use of an innovative communication tool. We are also excited that this piece has put Sage Hill School’s name out in the broader community as an institution that is eager to embrace new media, both inside and beyond the classroom. I have been contacted by a number of other independent schools who are interested in using this format for their marketing as well.


Thanks to Torrey for taking the time to share their process and reaction to using the infographic!


Monday
Oct152012

The History of Film infographic poster

The History of Film infographic poster

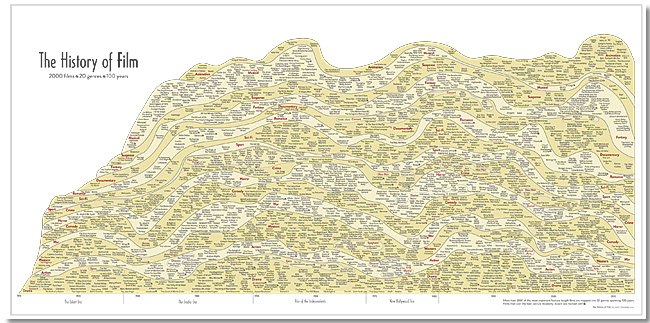
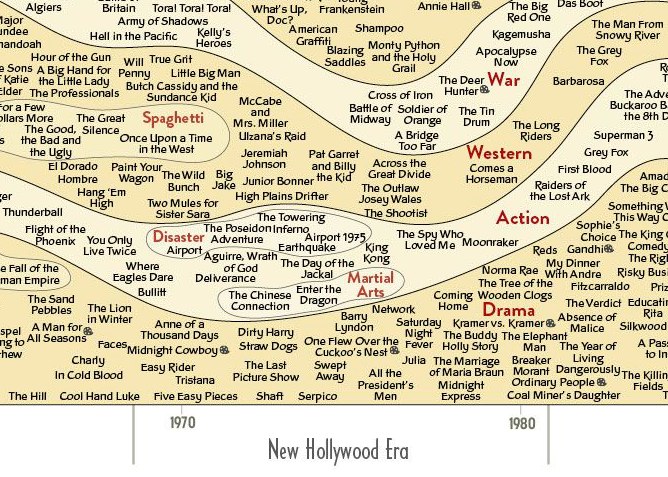
New infographic poster by Larry Gormley from HistoryShots.  The History of Film plots out the most important films of the last 100 years into a beautiful, flowing timeline that visually separates the films by 20 different genres.

This graphic chronicles the history of feature films from the origins in the 1910s until the present day. More than 2000 of the most important feature-length films are mapped into 20 genres spanning 100 years. Films selected to be included have: won important awards such as the best picture Academy Award; achieved critical acclaim according to recognized film critics; are considered to be key genre films by experts; and/or attained box office success.

The History of Film infographic poster

You can buy the 43” x 23” inch poster for $34.00 and definitely check out the zooming viewer to see the poster up close at Historyshots.com.

Great job Larry!

Wednesday
Oct102012

The Noun Project

Building a Global Visual Language from The Noun Project on Vimeo.

The Noun Project is beauty in its simplicity.

I post this video for two reasons:

  1. Even though there are no statistics in the video, I do consider this to be an infographic video.  The video is a visual explanation that “shows” the audience icons and illustrations that convey the meaning of representing human concepts in visual form.

  2. The Noun Project is a fantastic effort to design universal icons.  The idea is to design and gather illustrations of concepts that cross languages and cultures, and then make tham available to everyone under Creative Commons license to use in their own designs.  Obviously good for infographic design, but also for presentations, websites and even school reports.

From the Noun Project About Page:

Creating, Sharing and Celebrating the World’s Visual Language

The Noun Project is a platform empowering the community to build a global visual language that everyone can understand.

Visual communication is incredibly powerful. Symbols have the ability to transcend cultural and language barriers and deliver concise information effortlessly and instantaneously. For the first time, this image-based system of communication is being combined with technology to create a social language that unites the world.

Anyone can also register and submit their own designs to be considered for inclusion in the library.

Like designed by Marwa Boukarim from The Noun Project


Monday
Sep242012

Star Wars Infographic Flowcharts

Star Wars infographics

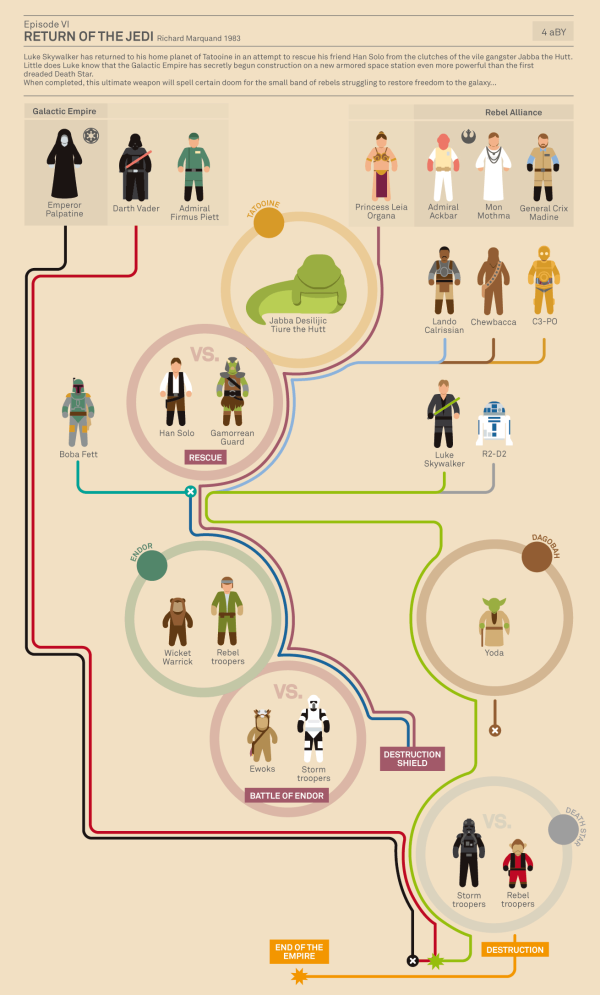
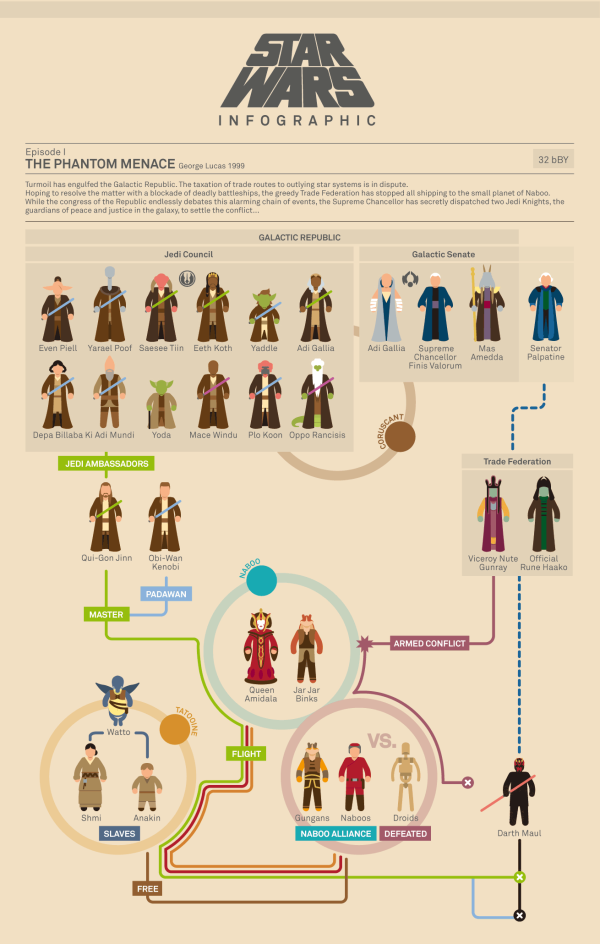
Marc Morera has designed some amazing Star Wars infographics charting the character progression, deaths and conflicts in the Star Wars movies, the animated series, comic books and major novels.  On the landing page, you will find them organized chronologically, so the Animated Series fits in between movies II and III.

Characters are illustrated as recognizable isotypes.  Each character’s plot line is color-coded, and the lines from the appropriate characters converge at circles representing the major conflicts along each story timeline. 

Star Wars infographics

The two examples shown here are reduced in size to fit on the blog, so go check out all of them on Marc Murera’s site for high-resolution versions.

Wednesday
Sep192012

Sip Statistics 2012

Sip Statistics 2012 infographic

A great way to wrap up the summer, the Sip Statistics infographic was a joint design project with Hotels.comTGIFriday’s and InfoNewt (my company).

The Hotels.com® Sip StatisticsTM uses data from T.G.I. Friday’s to help travelers do as the locals do and follow their drink-clinations by identifying favorite drinks in popular cities. T.G.I. Friday’s has also provided cool new summer drink recipes below to keep that summer feeling going all year round. 

The design combines Hotels.com Average Daily Room Rate information from the top U.S. cities with the geographic popularity of TGIFriday’s top summer drinks in those same cities.  A fun, engaging way to share some internal information only available from these two companies.

The room rates are clearly compared in rank order with the bar graph linked to the map locations, and the most popular drinks are also shown in rank order for each city using both unique drink galss icons and color coding.  The icons and color coding are carried down the design to the recipe section, where the drink content proportions are shown with a pie chart visualization.

Thanks to the teams at both Hotels.com and TGIFriday’s!

Tuesday
Sep112012

What is an Infographic? (explained with LEGOs)

 What is an Infographic? infographic

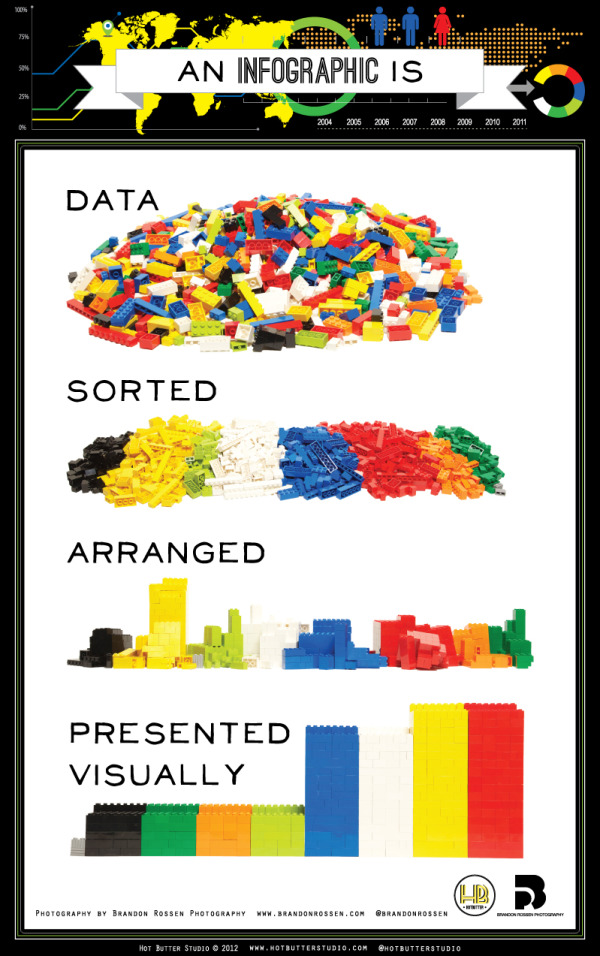
This infographic from Hot Butter Studio presents the idea of infographics in, well, an infographic! What is an Infographic? Data sorted, arranged, and presented visually! (And in a fun LEGO design!)

This is an infographic about what is an infographic. Using Lego blocks and photography we wanted to show that.a good infographic is simple and requires very little text.

Simple and fun, this is a really good design that has had some phenomenal success in social media sharing.

Thanks to Karyn for sending in the link!

Friday
Sep072012

Visual History of Cooper Black

Visual HIstory of Cooper Black infographic

Where’s Waldo?  More like where’s Cooper Black?  The font is everywhere! The Visual History of Cooper Black infographic was created by fibers.com to show their love for Cooper Black.

You might not know it, but you’ve seen Cooper Black. On the shop-front, in naughty magazines, album covers and candy wrappers - this depression era novelty font gets around. And why wouldn’t it, it’s curvaceous and friendly, as the type designer who created this font said, “It’s a typeface for farsighted printers with nearsighted customers.

We think Cooper Black is just lovely, with a rich and robust history - so we put that history down visually with this infographic. 

What a great topic and design!  This topic just screams for the design to show the reader actual examples of Cooper Black in action, and the use of images in the timeline does just that.  The design is focused on telling just one story, the timeline, and is fun & easy to read.

Thanks to Alia for sending in the link!

Thursday
Sep062012

White House Infographic: Extending Middle Class Tax Cuts

Extending Middle Class Tax Cuts Infographic

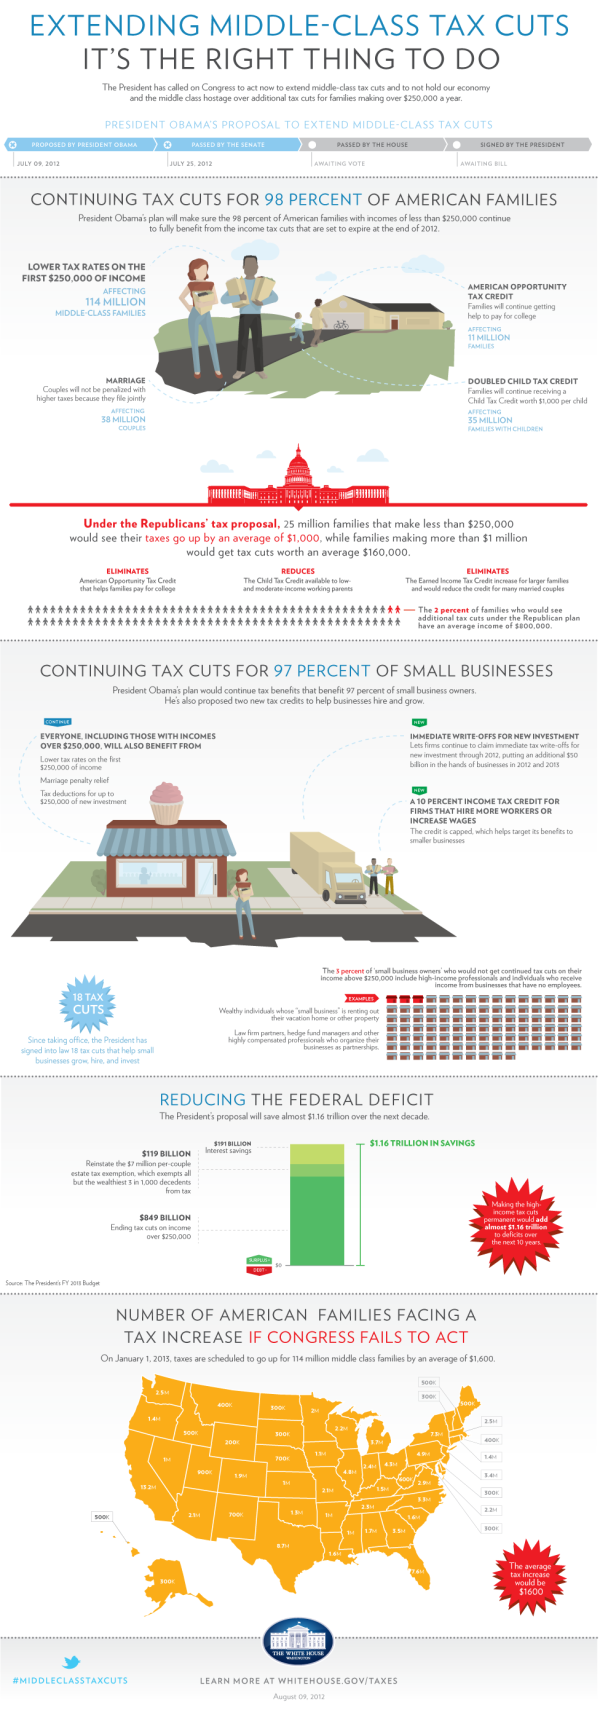
Here is a new infographic from the White House illustrating why Obama’s plan to Extend Middle Class Tax Cuts is the right thing to do. The infographic points out the pro’s for why it should be passed and what will happen if it isn’t passed.  I’m certainly not pushing a political bias, but I thought it would helpful to take a close look at some issues with the design.

From the White House:

Unless the the House of Representatives takes action before January 1, 2013, a typical middle-class family of four will see their taxes go up by $2,200 in the coming year.

President Obama is fighting to prevent that from happening. He is pushing lawmakers to get this done.

What we should do right now is give middle-class families and small business owners a guarantee that their taxes will not go up next year,” he said. “When families have the security of knowing that their taxes won’t go up they’re more likely to spend, and more likely to grow the economy. When small business owners have certainty on taxes and can plan ahead they’re more likely to hire and create new jobs. And that benefits all of us.” – President Obama


A few thoughts:

  • I like the progress bar design to visually show the current status of the issue.
  • Overall, the text is very small.  Even  when viewing the full-size resolution version on the landing page, some of the text is hard to read.
  • Sources are only listed for one statistic the Reducing the Federal Deficit section.  Where does the rest of the data come from, and why should we believe it?
  • Visualizing the stats in the first section would have been very helpful to put the numbers into context.  They should show the reader that 114 Million Middle-Class Families is a certain percentage of the total number of families in the U.S.
  • Nice use of red color to show the opposing proposal.  From a design standpoint, red = bad/negative so this visually shows the opposing plan with a subconscious negative bias.
  • The visualization of 100 people icons is correct, but would be easier for the reader to understand if it was organized in rows of 10.  Our number system is Base-10, so that’s how readers understand data.
  • Again, the rows of 15 small office buildings are hard for the reader to understand.  They should be rows of 10 to be immediately understandable.
  • The U.S. map should be display the values as a heat map.  States with higher values would have full color, and states with lower values would have lighter shades of the same color in accordance to the values.  Don’t make the reader read all of the text values and hunt to figure out the higher and lower values.  You don’t want to make your readers work that hard, when you can visualize it easily for them.
  • The “Learn more…” statement at the end is a good call-to-action at the end of the infographic, but they should also include the URL of the infographic landing page so people can find the original.

The White House has been experimenting with infographics for about a year now.  You can see my thoughts about two previous examples of The Obama Energy Agenda and The Resurgence of the American Automobile.

What do you think about the design?  What do you like, or would have done differently?

Found on the White House webpage

Tuesday
Sep042012

2011 Wisconsin Crash Calendar & Interview

2011 Wisconsin Crash Calendar infographic

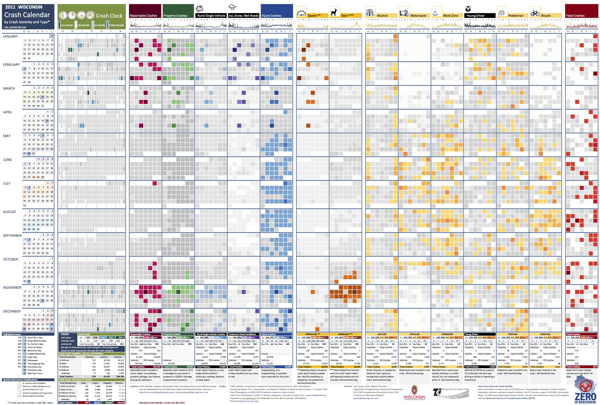
I love this infographic design!  Designed by Joni Graves, a Program Director at the University of Wisconsin-Madison Department of Engineering Professional Development (that’s a mouthful!).  I highly recommend downloading the PDF version and taking a closer look on your own.

The original version and a few variations are available on a couple different official sites:

The Wisconsin Bureau of Transportation Safety (BOTS) uses printed copies of the infographic calendar at meetings around the state with various groups to generate discussions about what causes crashes and how to interpret what the data shows.

This design is a great example of how visualizing the data allows the readers to see patterns in the data and much more easily understand the stories behind the data.  The color coding makes it easy to compare the data subsets, and the consistent layout to match a traditional paper calendar is very easy to follow.

There are so many findings you can quickly see in the big dataset.  Some are obvious, but many are surprising.  For example, you can clearly see…

  • Alcohol-related crashes happen primarily on weekends, and fairly consistently throughout the year.
  • Deer Season is clearly identified in Oct-Nov.
  • There was something special about July 1st…
  • Motorcycle, Work Zone and Bicycle crashes occur during the Summer months.
  • Ice, Snow, Wet Road crashes are highest in Jan-Feb, but what happened on April19th?  Late Winter storm?
  • Speed related crashes are primarily reported in the Winter months.
  • Fatal crashes are evenly spread throughout the year

Joni was also willing to answer some interview questions about this project and her design process:

Cool Infographics: What software applications did you use to create the Crash Calendar?

Joni Graves: EXCEL 2010 using Pivot Tables. Presentation advancements incorporate Microsoft’s PowerPivot using SharePoint.

Cool Infographics: Was the design created in cooperation with the Wisconsin Transportation Information Center, or was it an independent project? 

Joni Graves: I’m a Program Director at the UW-Madison Department of Engineering Professional Development and part of the WI LTAP (FHWA’s Local Transportation Assistance Program) / Wisconsin Transportation Information Center (TIC).

Cool Infographics: How long did the design take you to create?

Joni Graves: It’s a longer story, if you’re interested, but the skinny is that I started working on the Crash Calendar format in mid-April and previewed it at a meeting the end of the month. I had a learning curve with some of the intricacies, and spent about 200 hours on it during that two weeks! Since then it’s taken on a life of its own — and I am delighted by that!

Cool Infographics: Would you describe your design process?

Joni Graves: I would be happy to elaborate on this but, as an inveterate designer / tinkerer, I’ll confess that I’m always discovering some new way of formatting / displaying the data, and disappointed that there’s never enough time to do the new ideas justice …

Cool Infographics: What’s the most interesting thing you learned from the data?

Joni Graves: I’ve certainly enjoyed the design process! More importantly, it’s been incredibly satisfying to see people engage w/ the data using this intuitive representation, or to read their comments, because it’s apparent that it helps make the data far more accessible! And I have loved the comments / responses.

Cool Infographics: What was the hardest part behind designing the Crash Calendar?

Joni Graves: As I noted, there’s been a fascinating learning curve. But the hardest part has been stopping! As noted above, I’m always trying to “improve” it — and always running out of time.

Cool Infographics: What should we expect from future versions of the design?

Joni Graves: We currently have a multi-year version, a web-demo site, and a working 2012 version. I’m very excited about incorporating choropleth maps. Although it’s a very interesting “historic” document, the real goal is to provide a resource that is far more timely and potentially predictive for local users. 

I’m really excited about our plans to webize it, because the real idea is to expand it as a national project — using multi-year FARS data, WI data, and data from other interested states — and we really want to “unleash” it for others to actively use. 

Cool Infographics: Challenges?

Joni Graves: There’s been a wonderful response — and we are trying to figure out how to actually fund an expanded project w/ enhancements!

One additional thing to note was that Joni was inspired to create the whole design project by Nathan Yau’s post on Vehicles involved in fatal crashes in 2010 (which I posted about here earlier this year), and I think she has done a great job building Nathan’s initial visualization into some something much more powerful and effective.

Thanks to Joni for sharing!

Monday
Aug202012

ROI = Return On Infographics

ROI Return On Infographics


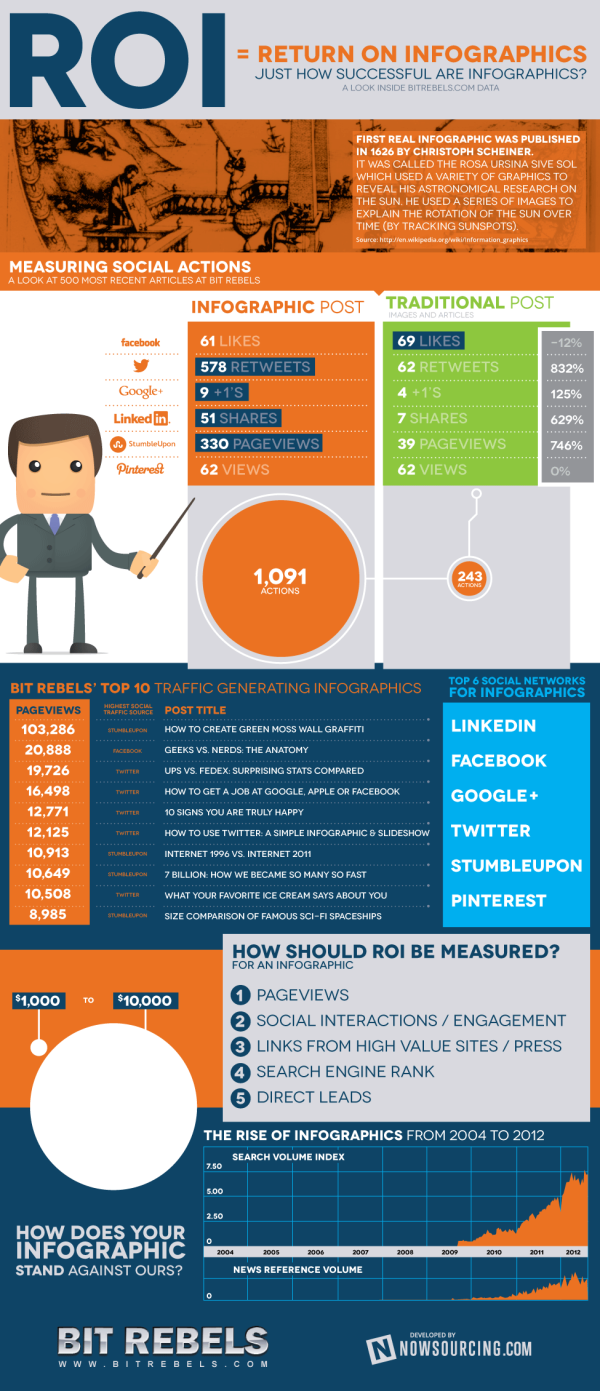
Infographics about infographics are always fun.  Return on Infographics by Bit Rebels and NowSourcing takes a look at some of Bit Rebels’ own data from releasing infographics as part of their marketing.

The impact of an infographic can be measured on many levels, which makes it all just a little bit more complex and complicated to present. With the help of NowSourcing, we have been able to produce an infographic that will compare the traffic and social action impact of an infographic post with a traditional post that does not involve an infographic. It’s through social media analytics that a clear image slowly emerges to tell a story that for some has just been a question without an answer.

They’re pretty clear about this, but remember that this design is completely based on internal data from Bit Rebels.  It may be a good indicator of infographics in general, but we don’t know for sure.

Bit Rebels has shared some fantastic data from their internal tracking, which will be of interest to the you, the readers of Cool Infographics.  However, the design makes a few mistakes, and we’re all here to learn how to make infographics designs better.

  • One of my pet peeves, the design messed up the size of the circles in the comparison table.  Based on the full-size infographic they released at 975 pixels wide, the smaller circle for 243 Actions is about 55 pixels in diameter.  Doing the match for the area of a circle, the diameter of the larger circle for 1,091 Actions should be about 117 pixels wide.  In the design, it’s actually about 256 pixels wide!  So instead of visually showing a shape roughly 4x larger, it’s actually showing a circle about 22x larger!  This is a “false visualization” and mis-represents the data.
  • Are these comparison data points an average or a total of the 500 posts?
  • How many infographic posts are compared to how many traditional posts?
  • Love the use of the actual logos from the social networks in the comparison table, and they should have continued that with the rest of the design instead of just text later in the design.
  • The blue bars behind the higher comparison value look like bar charts, but obviously don’t match the data.  They just fit the text, and have no visual relevance to the data.  An indicator icon or highlighting the entire column width would have been better than the bars.
  • Are the Top 6 Social Networks in rank order?  LinkedIN is the top social network for infographics???
  • The circles near the end of the design are also incorrect.  Instead of showing a 10x comparison to match the dollar values, the circles show an over 100x comparison!

Found on WebProNews, MediaBitro’s AllTwitter, and Visual.ly.  Thanks to everyone that also submitted it and tweeted links to it!