About
Randy Krum
President of InfoNewt.
Data Visualization and Infographic Design

Infographic Design

Infographics Design | Presentations
Consulting | Data Visualizations

DFW DataViz Meetup

Join the DFW Data Visualization and Infographics Meetup Group if you're in the Dallas/Fort Worth area!

Search the Cool Infographics site

Custom Search

Subscriptions:


Feedburner

The Cool Infographics® Gallery:

How to add the
Cool Infographics button to your:

Cool Infographics iOS icon

- iPhone
- iPad
- iPod Touch


Read on Flipboard for iPad and iPhone

Featured in the Tech & Science category

Flipboard icon

Twitter Feed
From the Bookstore

Caffeine Poster

The Caffeine Poster infographic

Entries in design (479)

Tuesday
Apr242012

Gov 2.0 Infographic: Bringing the Tobacco Control Act to Life


In 2011, Enspektos, a health marketing communications innovation consultancy, invited InfoNewt (my company) to be involved in a special project the firm was leading on behalf of the Food and Drug Administration’s (FDA) Center for Tobacco Products (CTP).  As a new federal agency, the CTP is tasked with regulating tobacco products and preventing tobacco use – especially among youth.

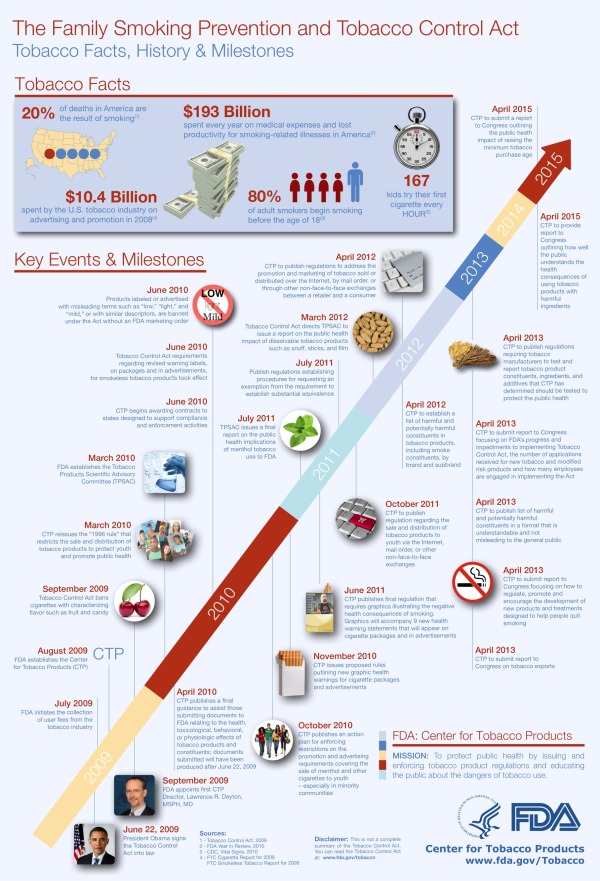
During the project, we collaborated with the CTP to help create The Family Smoking Prevention and Tobacco Control Act: Facts, History and Milestones, an infographic timeline that covers the past and future actions related to the Tobacco Control Act passed in 2009.

The Family Smoking Prevention and Tobacco Control Act (Tobacco Control Act) is an important piece of legislation with many requirements. This infographic illustrates the history, rationale and major events associated with the Act. The Tobacco Control Act provides all of the events, deadlines and requirements in full and should be used as the final resource for information about the Act.

The infographic is yet another example of Gov 2.0, or the effort to utilize a range of digital technologies to improve government transparency and public understanding of how federal agencies function.  The original Tobacco Control Act is a 68-page document available online, but in actual practice that isn’t easily accessible or understandable by the general public.  The FDA has created several tools to help the public understand the Tobacco Control Act, like a snapshot overview of the Act, an interactive scrolling timeline viewer, a searchable interface and the infographic timeline.

On Wednesday, April 25th, the FDA is holding a LIVE webinar to share the different tools they have created to help everyone access and understand specific information from the 68-page law. 

Attend Our Live Webinar!

As you might expect from an official government publication, the design went through many iterations of review and revisions.  In my opinion, the final infographic is text-heavy, but strikes a balance between optimal design and content that was vetted and approved by many different individuals at the CTP. 

Fard Johnmar, Founder and President of Enspektos agreed to answer some questions about the project.

Cool Infographics: How do you think the infographic and other tools will aid public understanding of the Tobacco Control Act and the CTP? 

Fard Johnmar:  I think the infographic and other tools are an important step for the federal government.  Transforming dense and complicated legislation into simple, visually appealing information products is a very difficult process.  You have to balance the wish to make things clear and concise with a requirement that information be as accurate and complete as possible.  

We had two primary goals: The first was to improve the public’s understanding of the Tobacco Control Act.  The second was to get people within FDA comfortable with using new tools that help visually communicate important regulatory and public health information.  Now that this project is complete, I think FDA will be looking for other ways to communicate about its mission and activities in more visually appealing ways.

Cool Infographics: Do you see other health and medical organizations using visual communications techniques? 

Fard Johnmar: Absolutely.  In fact, since we published the Empowered E-Patient infographic a few years ago, I’ve seen a number of health organizations using infographics to communicate about a range of topics, including GE for its Healthymagination project (click here for a few sample infographics).

Cool Infographics:  How difficult was it to push the infographic through the FDA approval process

Fard Johnmar: As you can imagine, getting final approval for a novel visual project like this can be difficult for large organizations.  However, there was a real passion for the project from Sanjay Koyani, Senior Communications Advisor at the CTP and other members of his team.  They helped to successfully meet all of the legal requirements and answer the numerous questions posed by colleagues at the CTP.  Now there is a higher comfort level at the agency with utilizing these types of visual tools to tell the CTP story.

I truly appreciated being involved in the project, and think this is a really big step towards making the often overly complex information released through official government channels more understandable to more people.

Thanks to Enspektos and the team at the Center for Tobacco Products!

Tuesday
Apr102012

How Animals See The World

Ever wonder how you look to your dog or cat? Or how about the shark as he swims towards you? (Lets hope  you haven’t thought of the second one…) Well have no fear, all your answers lie within the How Animals See The World infographic from Mezzmer

Have you ever stopped and wondered what version of the world your beloved dog or cat sees the world in?  How is their perception colored and how do they perceive you?  Most of us take for granted the gift we are granted with sight, but it may surprise some of you to find out that many animals actually have much better vision than we do.  In fact, some see the world with some precision and accuracy, they put our eyesight abilities to complete shame.  Read on to learn more about the unique ways our animal friends see the world…

The design is longer than I like for infographic, but the content is fascinating.  Not many data visualizations, but I really appreciate the designer showing comparisons between what a human sees, and the equivalent view from the animals. 

Mezzmer is an eyeglass online retailer, so this infographic topic is information relevant to their business without feeling like an ad.  A great topic selection for a Marketing infographic.

Thanks to Christina for sending in the link!

Friday
Apr062012

Augusta National Golf Club - Then and Now

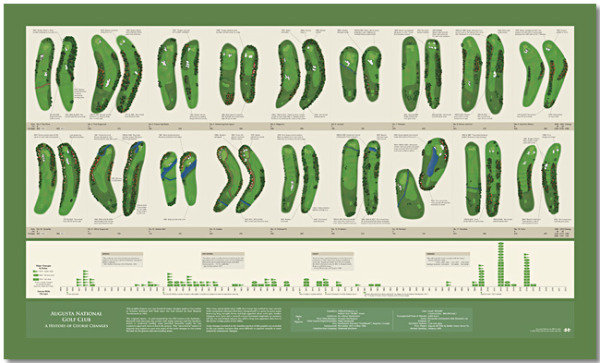
Bill Younker from Historyshots.com has designed a new infographic poster!  Augusta National Golf Club- Then and Now, shows how the famous golf course has changed since its first Masters Tournament 79 years ago!

Augusta National Golf Club has undergone continuous modification since hosting its first Masters Tournament in 1934. This graphic depicts the more than 100 major changes made to the course over the past 79 years. At the top is a visual side-by-side comparison of each hole for 1934 and 2012. Below the hole comparisons is a timeline that maps tee, fairway and green area changes year-by-year. The combination of visual comparison and detailed timeline provides a sweeping overview of all the major changes made since 1934.

This is a great design that demonstrates how simple visuals can be used to show the viewer differences between the hole designs.  By showing a terrain map of each hole then and now, side-by-side, the poster is easy for viewers to compare the changes and enjoy.

You can buy the 40” x 24” inch poster for $34.95 and definitely check out the zooming viewer to see the poster up close at Historyshots.com.

Great job Bill!

Wednesday
Mar142012

Romance Reboot: Safe Online Dating Tips from ADT

What did you do for Valentines day? Did you go on a date? Did you meet them online? The Romance Reboot: Safe Online Dating Tips from ADT infographic from homesecuritysource.com provides tips for the 5.5 million singles who use online dating on how to stay safe while finding their true love!

This one is cool because of the new, innovative way to animate the infographic.  You’ll have to view it on the original posting to see it, but the illustrations and visualizations are animated as you slowly scroll down the page.  This design itself is too gaudy for my tastes, but BIG kudos to the designers for trying something new to push the envelope of infographic design!

The bottom is missing the URL for the original posting, which is a big mistake because it makes it hard for readers to find the cool animated version.  It’s also missing a copyright statement and any mention of the designer(s).

Thanks to Andrew for sending in the infographic!

Wednesday
Feb292012

The Startup Ecosystem: Predator vs. Prey

The Startup Ecosystem: Predator vs. Prey is a fun but informative infographic from udemy.  It looks at the different roles related to tech startup companies in an amusing way by personifying them as fish in the sea.

The startup waters are murky and full of hidden dangers. Below the surface, the ecosystem rests in a delicate balance between predators and prey.

To help you navigate these stormy seas, we’ve created the infographic below. Read on to find out where you stand in the startup food chain.

This one is light on data, but does convey valuable information to the reader.  The visual scale of Ubiquitous to Endangered is easy to understand, and the color coding is consistent throughout the design.

Found on Best Infographics

Monday
Feb272012

iPad3: USA in anticipation of the new iPad

Anticipation is building strong momentum expecting the release of the next iPad from Apple in the near future.  Ask You Target Market (AYTM.com) is an online survey service, and they gathered data from a couple of their own surveys to compile the iPad3: USA in anticipation of the new iPad infographic.

The rumor is that the iPad 3 announcement will come in the first week of March, but doesn’t specify when it will be released. For reference, the iPad 2 was announced on March 2nd of last year, and available on the 11th.

There are some significant changes expected and to gain a better understanding on the current state of the American consumers’ current iPad usage and anticipation of the iPad 3, AYTM conducted DIY market research utilizing our online consumer panel and survey tool. The highlights of our discoveries are encapsulated in this infographic:

This Infographic is based on a survey of 2000 Americans who don’t own an iPad (request full stats report by e-mailing us: support [at) aytm.com) and another survey of 500 iPad owners (open full stats report) that we’ve collected for you on aytm.com in February 2012.

A few thoughts about the design:

  • I like the idea to that each fingerprint on the iPad to represents 100,000 people, but because it’s a data visualization, the different sizes of the fingerprints makes you think that the size has meaning when it really doesn’t.  It was so subtle, I initially missed the number 3 reversed in the fingerprints.
  • In the “What could Apple do” section, the illustrations do help give meaning to each of the statistics, but because the numbers are all in the text, their impact is lost.  These values should have been visualized.
  • The model distribution is clear, and easy to understand.  For the Models breakdown, I really like the use of the pie chart to represent two levels of data.  Primary is the size, and the secondary level is the WiFi vs. 3G split.
  • I really like the 3G satisfaction breakdown.  Very easy to understand.
  • Great use of the logos and colors in the Carrier split data.  Orange isn’t in the AT&T logo, but is a very dominant color on their website, and Verizon got a red bar to match their logo and primary website color.
  • The Family trees are hard to understand and the 1.7x visualization isn’t clear.
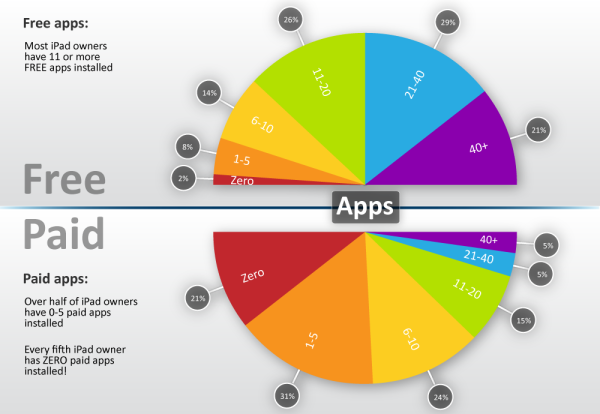
  • I’m not sure why they picked area charts for the apps visualizations.  That’s really the wrong type of visualization for the data since these are all supposed to add up to 100% of users.
  • The male vs. female bar charts work well, and are easy to understand.  I appreciate that they were consistent with the female number always first, and of course the color-coding work perfectly.
  • “Where iPads are used” is really just an illustration, and doesn’t visualize the percentages at all.  I simple stacked bar under the illustrations (like the carriers above) would have worked nicely.
  • Surpirisingly, I really like the use of word clouds here.  You don’t need the specific numbers, and the word cloud visualization makes the point well because the top responses are so overwhelming.
  • I love that they gave credit to the designer, Lev Mazin!  It doesn’t hurt that he’s the CEO and Co-founder of AYTM.com, but happens to also be a graphic designer.

Only one thing missing at the bottom: the URL to find the original infographic.

Found on Mashable

Friday
Feb242012

See Mix Drink: Infographic Cocktails

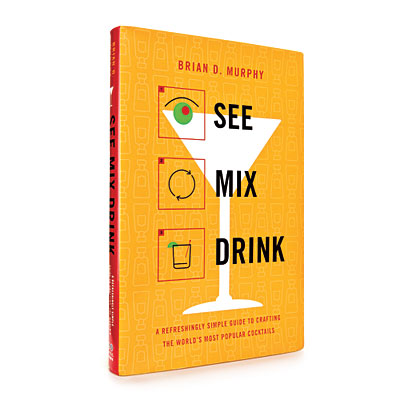
The See Mix Drink Cocktail Guide is a fabulous infographic drink recipe book from Brian D. Murphy (@murph_e).  Currently available for about $10 on Amazon.com, it’s on my wish list.  Featured on GQ.com back in October when it was released, I have been totally remiss by not posting about it until now.  (My apologies Brian!)

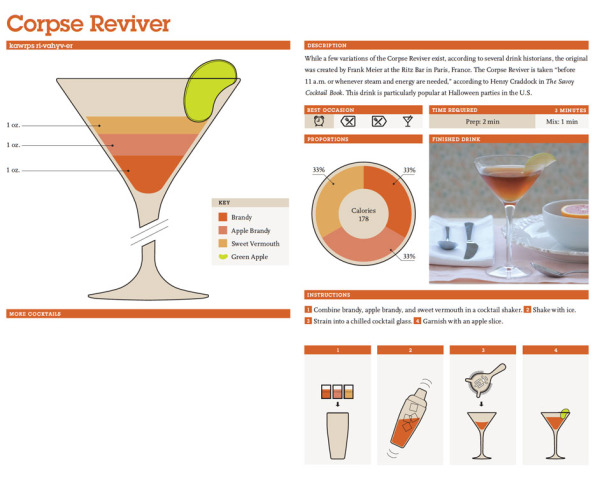
Have you tried mixing a Mojito? What about a Rusty Nail? Or a Cosmopolitan? With See Mix Drink, the first-ever cocktail book to offer instruction through info-graphics, making the drinks you love at home is as easy as, well, See, Mix, Drink.

This unique, illustrated guide graphically demonstrates how to make 100 of today’s most popular cocktails. For each drink, color-coded ingredients are displayed in a line drawing of the appropriate glassware, alongside a pie chart that spells out the drink’s composition by volume for intuitive mixing. No other cocktail book is this easy or fun. Instantly understandable 1-2-3 steps show exactly how each drink is prepared, and anecdotes, pronunciation guides, and photographs of the finished drinks will turn newbie bartenders into instant mixologists. 

The GQ.com feature has the designs for ten of the recipes from the book.  They are all simple to understand, and easy to follow.

One thing I would suggest to improve the visualization design style is to combine the key and the ingredient portions.  No need to make the reader look to both sides of the glass illustration to figure out how much of each ingredient.  Just putting the name with the amount on the left side and getting rid of the color key would eliminate an eye motion for the readers.

Thanks to Brian for sending in the link (back in October!) and congratulations on the publication!

Friday
Feb172012

Shutterstock Global Design Trends 2011

The Global Design Trends 2011 infographic from Shutterstock shares some of the image usage data that only they have due to the nature of their business.

After 8 years, 17 million images and over 200 million downloads, Shutterstock has become one of the world’s leading marketplaces for visual media. We have artists and photographers from more than 100 countries, and customers in more than 150. But perhaps most significant about these milestones is that it has led to tens of thousands of image searches each day – giving us valuable insight into design trends around the world.

From vintage-themed photographs, to vibrant vector graphics, here’s an infographic detailing what visual stories were told over the last year.

I love that Shutterstock has some unique data internally that they are analyzing in aggregate and now sharing with the world.  It’s not complicated, but I love that they actually included some of the most downloaded images in the design.  They are showing the reader what was popular instead of just telling the reader about it.  My favorite section is the Evolving Visual Vocabulary showing how the meaning of the image keywords is changing over time.

They made a couple unusual publishing choices.  The image posted on the blog is 714px wide (an odd number) so the small text is blurry and pixelated.  I don’t think they have enough detailed data in this design for a zooming viewer, but if you click on the image from their blog post, it takes you to the full 3,300 pixel wide image loaded into Zoom.it.  They also link to the high-resolution JPG image file, and (a great idea!) a lightbox on Shutterstock that includes all of the images highlighted in the infographic.

A handful of statistics are just listed in text instead of visualized like they should be: 150 countries, 16 million downloads, 6 million downloads, 5 million downloads, etc.

A couple standard things missing that a lot of designers seem to consistently miss: a copyright statement, the URL for readers to find the original infographic landing page (the specific blog post on Shutterstock in this case), and a credit mention for the designer (Shutterstock is all about designers!).  I hope the team at Shutterstock paid the license fes for using these images in their infographic design!  No need for a Sources statement, since all of the data comes from their own site server data.

Thanks to Aaron for sending in the link!

Monday
Feb062012

Infographic Events Calendar 2011-2012

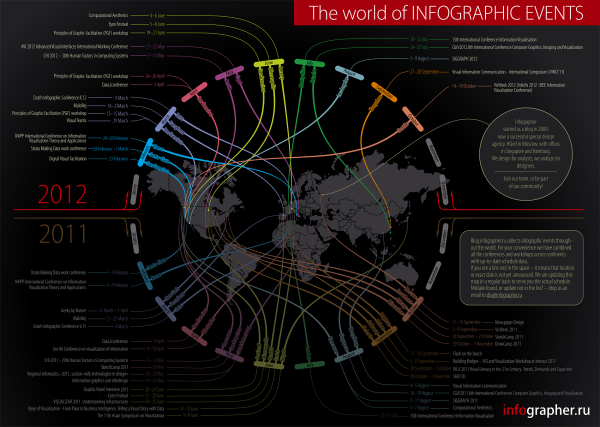
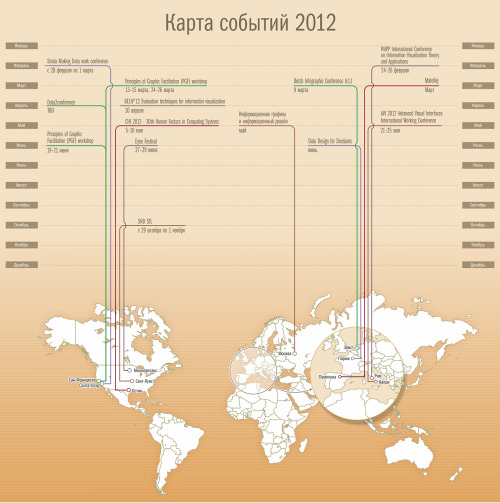
Outstanding calendar-map infographic from Infographer.ru, a Russian infographics site and design agency in Moscow (view in English).  The Infographic Events Calendar 2011-2012 shows many (but not all) visualization, data and infographic conferences and events around the globe.

For everyone who is interested in information design we prepared the events calendar. We found over 44 conferences and workshops, dedicated to infographics and visualization topic all over the world.

The idea to make this kind of ‘map-calendar’ of events appeared in our mind a long time ago, we started to collect data in 2011 and suddenly 2012 started. So we decided to combine both years and show the history for 2011 and actual events for 2012, which you can use for your personal planning.

They collected over 40 conferences and workshops dedicated to information visualization for last year and the upcoming schedule for 2012.  The calendar-map color codes the events by month and obviously connects them to the correct location on the world map.

If you know any corrections or additions to the event included, please post them in the comments!  I know they will be reading them, and would welcome all feedback.  Here are a few events I think they should add to their list:

  • South by Southwest Interactive, Austin, TX, March 9-13, 2012
  • TDWI World Conference (Tableau), Las Vegas, NV, February 13-15, 2012
  • Big Data 2012, Paris, France,  March 20-21, 2012

I like the text of the city name included in the connecting lines, and the months with no events are gray so they don’t add to the visual noise of the bright colors.  Somewhere on the design they should have included the URL for people to find their original posting.  When this get shared online, readers will have a hard time finding the original site.

Infographer also posted some behind-the-scenes information about the development of the design.  Check out their early drafts in the complete blog post.

Thanks to Irina for sending in the link and posting the English translation of the development process!

Tuesday
Jan312012

The Psychology of Color

The Psychology of Color is a cool infographic from CertaPro Painters of Louisville.

This new infographic from CertaPro Painters of Louisville shows how color evokes emotion and triggers your senses. It beautifully explores colors that should and should not be used in interior decorating, as well as why certain colors are used in advertising.

Designed by NowSourcing.com, I love the visual appeal of this design.  Obviously, it’s bright and colorful, but in all three sections of the layout (home, colors and advertising) they provide visual examples to back up their observations about different colors. I would love to have a house that colorful!

There is much more information on this subject, but this design also kept the information fairly simple and straightforward.  The colors make the design very “busy”, but the design doesn’t try to communicate too much information to the reader.

The design is missing the URL to find the original landing page, and a copyright statement.  I also found it odd that they needed to clarify that M&Ms are “an American Chocolate Candy”.  Aren’t M&Ms an international brand?

Thanks to Jay for sending in the link!  Also found on Infographic Journal.