About
Randy Krum
President of InfoNewt.
Data Visualization and Infographic Design

Infographic Design

Infographics Design | Presentations
Consulting | Data Visualizations

DFW DataViz Meetup

Join the DFW Data Visualization and Infographics Meetup Group if you're in the Dallas/Fort Worth area!

Search the Cool Infographics site

Custom Search

Subscriptions:


Feedburner

The Cool Infographics® Gallery:

How to add the
Cool Infographics button to your:

Cool Infographics iOS icon

- iPhone
- iPad
- iPod Touch


Read on Flipboard for iPad and iPhone

Featured in the Tech & Science category

Flipboard icon

Twitter Feed
From the Bookstore

Caffeine Poster

The Caffeine Poster infographic

Entries in visual (320)

Wednesday
Mar312010

What's In MyBag?  [photos]


Chris Watson, from Visual Think Map, started a new network on Ning called “What’s In MyBag” for anyone to share photos of all the stuff they carry in their briefcase or bag.  It’s a fun, visual project that can share a lot of information within only one photo.

Join and share your own photo!

Friday
Mar262010

Japan - The Strange Country [infographic video]

Japan-The Strange Country (English ver.) from Kenichi on Vimeo.

Created by Kenichi Tanaka for his final thesis project, Japan - The Strange Conutry is an infographic video exploring the statistics about Japan and the Japanese people. Available in both English and Japanese language versions.

You can see Kenichi’s work on his design website or his blog.


Thanks to mobarts for the link!

Wednesday
Mar102010

What Do You Suggest? A Visual Search Interface

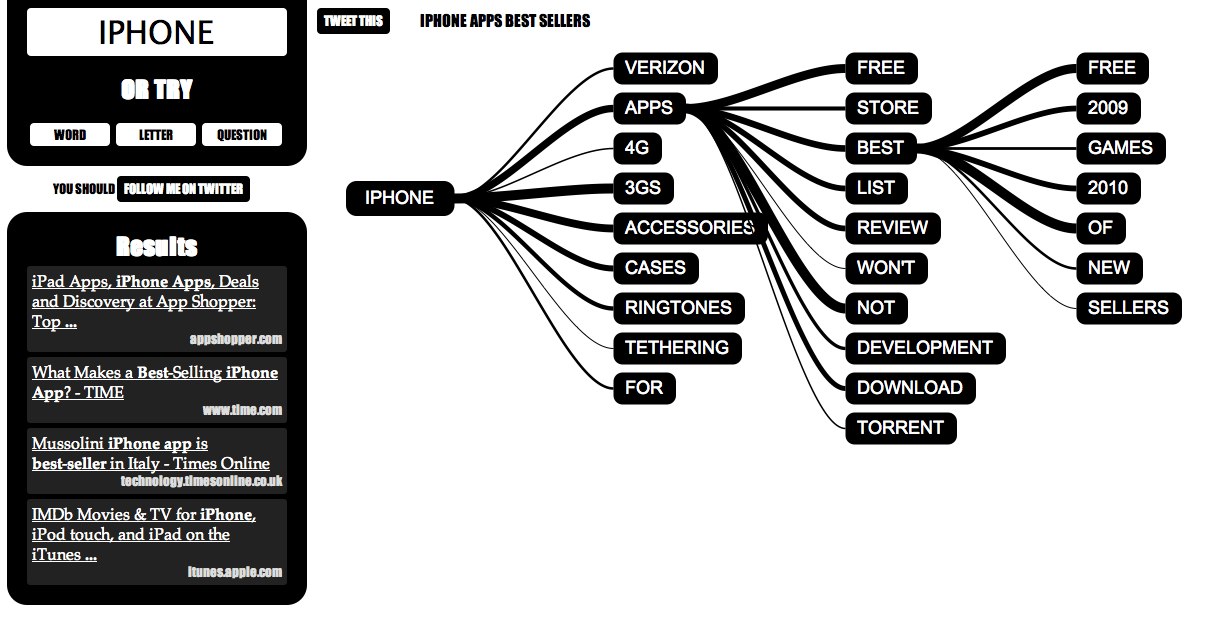
Using a mindmap-style visual interface, WhatDoYouSuggest.com shows you the search results from Google in an easy-to-use interface.  Created by Simon Elvery, the interface returns the top words that Google suggests based on your initial query.  By clicking on the relevant words, the search becomes more relevant, and more words are suggested to narrow your search.

Both the order of words and the thickness of the lines are meaningful.  More detailed information is available on the Simon’s blog.


What Do You Suggest takes a seed from you (or gives you something random) then guides you on a journey through language and the collective lives of Google users.

Using data from Google to make suggetions on where you might like to go next, What Do You Suggest is an experimental and interactive environment designed to explore how we use language and search on the internet.

  • The words that appear first in each set of options are the words Google thinks are most likely to be what people are looking for.
  • The words joined by the thickest lines are ones which will produce the most results if you searched for them on Google.


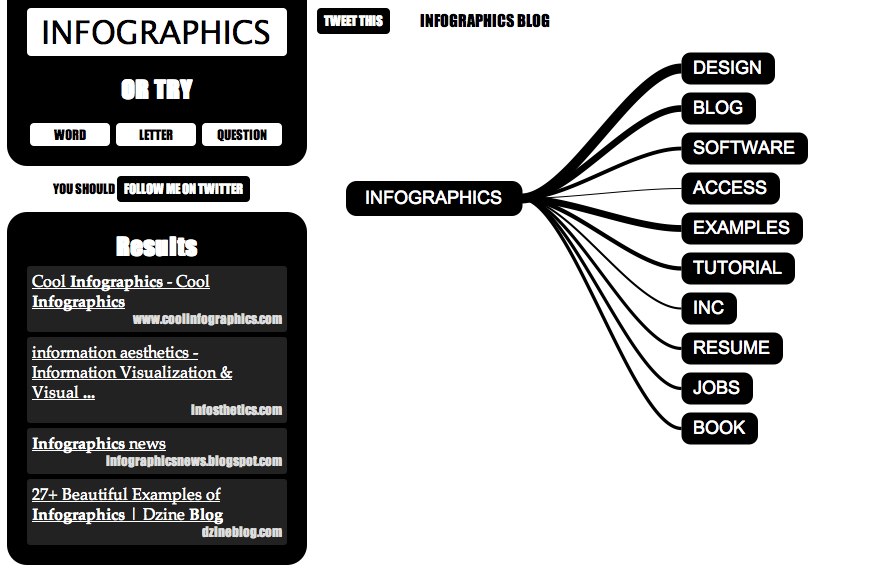
Of course, I had try see what “infographics” cam up with…

Found on Information Aesthetics and Gizmodo.


Wednesday
Feb172010

CD Laddering Investment infographic

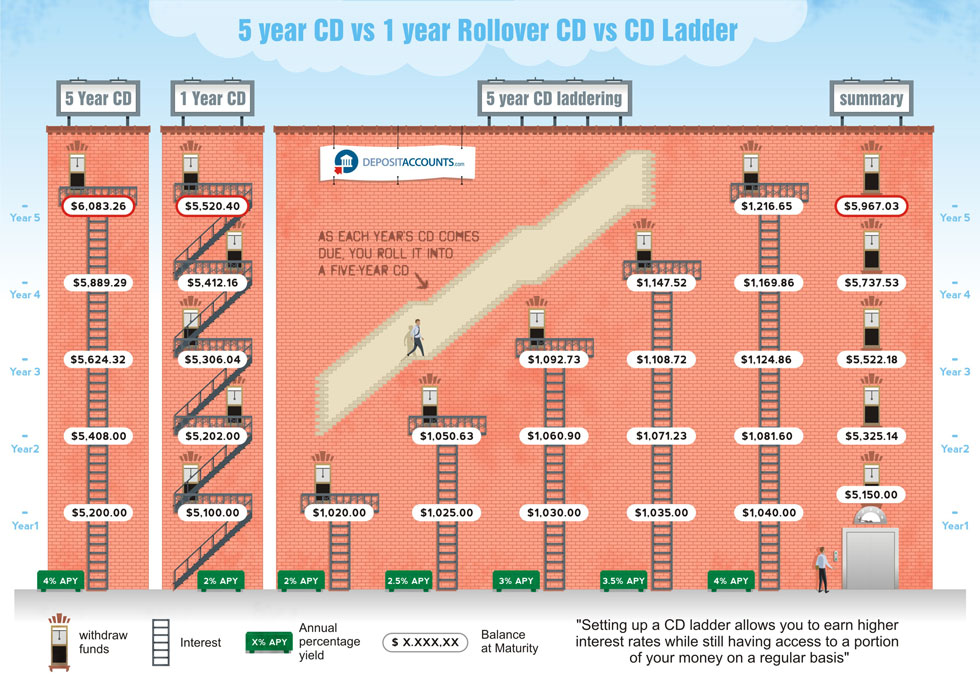
Designed by Derri Hasmi for DepositAccounts.com, this CD Laddering infographic does a great job helping to explain the investment theory of CD laddering as compared to investing in standard CDs.

CD laddering is a strategy that allows you to take advantage of the higher cash rates offered by CDs, while at the same time ensuring that you have access to your money regularly. The most common type of CD ladder is the five year ladder. In this scenario, you open five different CDs. Let’s say that you check your savings account, and you have $15,000. You want to keep $5,000 for emergency purposes (move it to a high-yield savings account if it isn’t in one already), but use the remaining $10,000 to get your CD ladder started.

Thanks Jeremy!

Monday
Feb152010

My Digital Life 2.0: A Consumer Gadget Map

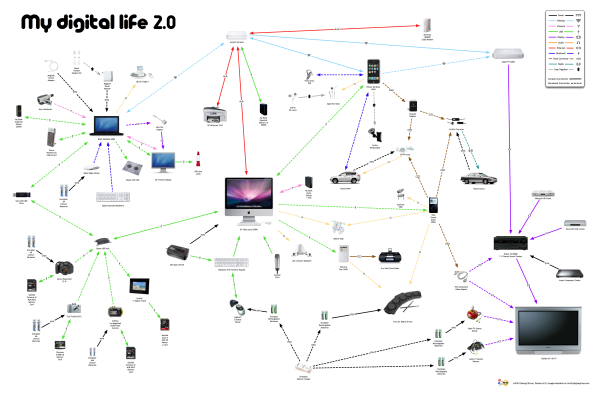
Presenting My Digital Life 2.0!  I’ve significantly updated the My Digital Life infographic I designed last year.  In addition to including many more gadgets and accessories in the graphic, I changed the connection lines to indicate either a constant or occasional connection.  The line arrows also indicate the direction of information flow (sometimes one-way, sometimes both ways).  You can see the high-resolution images on Flickr by clicking on the images.
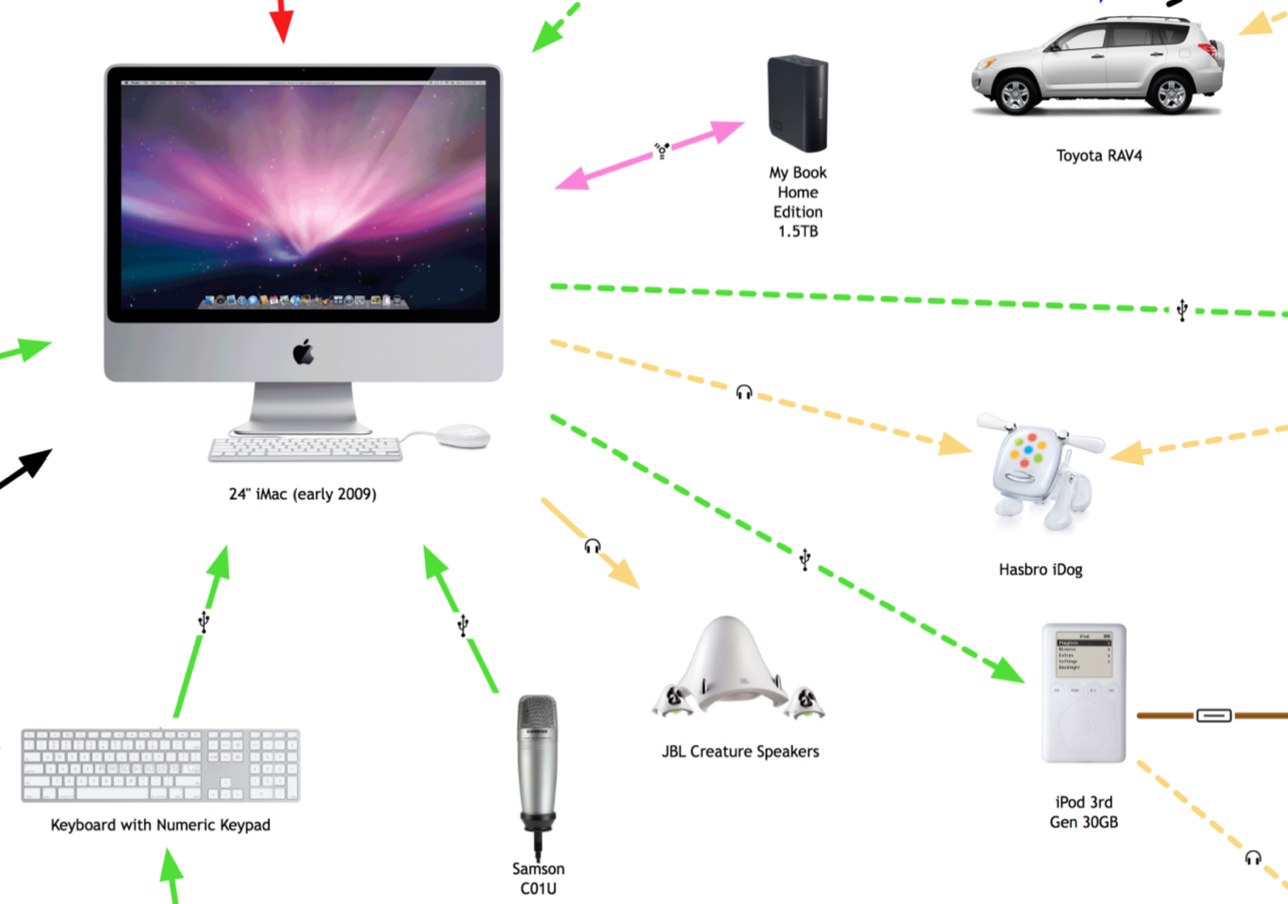


The infographic highlights many of the decisions a consumer has to make with each new gadget they buy.

  • What kind of batteries should I use?
  • How much and what kind of memory will I need?
  • How do I connect to my existing gadgets and computers?
  • How will it work in my car?
  • Do I have an available connection?
  • Where can I add a new gadget (like a new hard drive)?

For the purpose of Product Development and Marketing, this is a fantastic way to map out the experiences a consumer faces and how new products will fit into their life.  For example, if you were at a company designing a new consumer electronic gadget how would your product fit into your target consumer’s life?  What decisions would they have to make about your product?  Is it easy for them to understand if your new product will work with their existing setup?

Even if you’re only a headphone manufacturer, it’s incredibly important to understand the whole consumer experience.
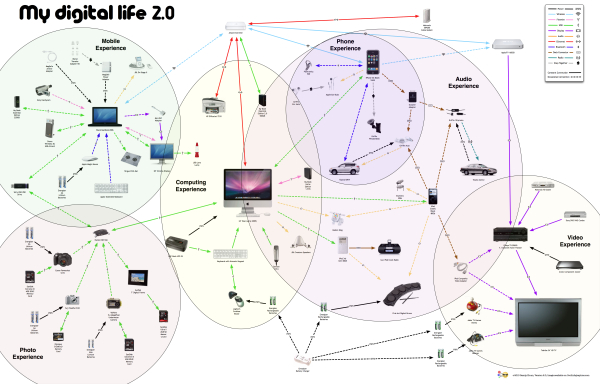


You’ll notice that the map began to form natural groupings that I call experience zones.  Here’s a modified version that highlights six specific areas of experience: video, audio, phone, photos, computing and mobile.  From an average consumer perspective, I know I’m missing two potential additional areas: Gaming and Reading.  I don’t own a gaming console (Xbox or Wii) and I don’t own an e-reader (Amazon Kindle or Sony Reader).

Since I’m a technology geek, I already understand how all of these connections work…in my head.  I’m the one who set them up and I use them every day.  However, imagine your parents or grandparents trying to understand all of these connections, and that doesn’t include the software communication between many of these gadgets.
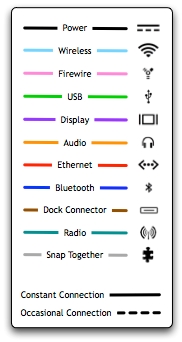
I’ve added a few new types of connections, and included the different line types in the legend.  I also took a few liberties with the connection types.  “Snap Together” indicates any type of physical connection, like the Ear Jams snapping onto my Apple Earbuds and also the iPhone snapping into the car mount.  I left the camera memory cards as USB connections without getting into any more detail of the inner connections in the cameras.  The legend is not truly necessary because in true Tufte form, I included the connection icons in each of the connection lines, but I decided to leave the legend in to identify any icons that people aren’t familiar with.

The biggest challenge in designing the infographic, was arranging everything so that none of the lines crossed.  To make this happen, I ultimately had to skip a couple connections.  I have used the Etymotics earbuds with the MacBook occasionally, but that connection line would have been horribly ugly, crossing the entire graphic.

Friday
Feb122010

101 Muppets of Sesame Street infographic

Mahna Mahna!  Not always about using new programming languages to plot massive amounts of data, infographics can be fun too.  From the National Post comes the 101 Muppets from Sesame Street.  Who would want to read a boring Cast of Characters list.  Visualizing the information is what makes it fun as you try to recognize some of the more obscure characters.

The muppet who sings Mahna Mahna is in there, can you find him?

Some Muppet faces are more familiar than others, so here’s a handy guide to some of our favorites in celebration of Sesame Street’s 40th year on the air!

In celebration of Sesame Street’s 40th season, Steve Murray created this visual of 101 of the most used characters over the years using data from muppet.wikia.com.  The infographic was made interactive with the help of Rebecca Yanovskaya, so when you mouse over any muppet you get a popup with their name and a little history.

Don’t forget to check out the new Muppet videos on the MuppetsStudio channel on YouTube!

Thursday
Feb112010

Tableau launches FREE Tableau Public today!


Today, Tableau Software launched a data visualization package for websites called Tableau Public.  This package is intended to be used be anyone with a website to embed visualizations on their own sites.

Tableau Software today launched a new product that brings public data to life on the web. Tableau Public, available for free, lets anyone who posts content to the web easily create interactive visualizations and publish them to blogs, web sites, Twitter feeds or anywhere online. Instead of viewing static charts or tables, Tableau Public lets people answer questions and share data interactively on the web. 

The visual above was created using Tableau Public to demonstrate its capabilities, but you’ll notice that I’ve been able to embed it here on Cool Infographics as well.  The visualizations created allow users to share, embed and link to your graphics from anywhere…making them social!

They’re also interactive and linked together.  For example, click on the Bronx in the data above, and all of the visuals will highlight just data related to the Bronx.  The map even adjusts to only focus on the Bronx.

About the NY City Graffiti visual:

Looking borough by precinct across The Big Apple, one can quickly see that there are some differences in how graffiti is handled. For instance, Staten Island has very little graffiti, but the graffiti they do have lingers without cleanup for almost twice the citywide average. On the other side of the spectrum, Manhattan has over 2000 incidents of graffiti, but it is cleaned up in less than 17 days on average.

Look for more features from Tableua Public here in the future as I experiement and play with it.

Thanks to Elissa at Tableau Software for the link and information!


EDIT:  Here’s a news video as part of the announcement.  Thanks Adriana!

Tuesday
Feb092010

The Crayola Color Timeline, 1935-2010

From WeatherSealed.com, the visual timeline of Crayola crayon colors.

Ever industrious, Velo also calculated the average growth rate: 2.56% annually.  For maximum understandability, he reformulated it as “Crayola’s Law,” which states:

The number of colors doubles every 28 years!

Found on ChartPorn


Monday
Feb082010

Infographic Airplane! from Kulula Airlines


This is a great new infographic paint job on a Kulula Airlines (a South Africa airline) Boeing 737, informative and humorous.  With labels detailing many of the plane’s features, this looks like a a training plane.  See the high-res photos on Flickr.


“The Big Cheese” identifies the pilot seat, and Co-Captain is on the other side for the co-pilot.  “Jump Seat” is for “the wannabe pilots”.


Even the location of the Black Box is identified with the useful information “(which it’s actually orange).”  Who knew the loo was also the “mile-high club initiation chamber”?!?


From the Flightstory Aviation Blog

In addition, the following descriptions of plane parts can be found:

  • galley (cuppa anyone?)
  • avionics (fancy navigation stuff)
  • windows (best view in the world)
  • wing #1 and #2
  • engine #1 and #2 (26 000 pounds of thrust)
  • emergency exit = throne zone (more leg room baby!)
  • seats (better than taxi seats)
  • some windows = kulula fans (the coolest peeps in the world)
  • black box (which is actually orange)
  • landing gear (comes standard with supa-fly mags)
  • back door (no bribery/corruption here)
  • tail (featuring an awesome logo)
  • loo (or mile-high club initiation chamber)
  • rudder (the steering thingy)
  • stabiliser (the other steering thingy)
  • a.p.u. (extra power when you need it most)
  • galley (food, food, food, food…)
  • boot space
  • ZS-ZWP (OK-PIK) = secret agent code (aka plane’s registration)
  • overhead cabins (VIP seating for your hand luggage)
  • fuel tanks (the go-go juice)
  • cargo door
  • aircon ducts (not that kulula needs it… they’re already cool)
  • front door (our door is always open … unless we’re at 41 000 feet)
  • cockpit window = sun roof
  • nose cone (radar, antenna, and a really big dish inside)


Photos were posted on Flickr by member shanairpic.  I found them through Nathan’s post on FlowingData and thanks to Jesse for sending in a link.

Tuesday
Feb022010

Big Brothers: Satellites Orbiting Earth

Michael Paukner has created a great infographic, Big Brothers: Satellites Orbiting Earth.  Visually showing which countries own all of the space junk currently orbiting Earth (functional, dysfunctional and floating debris).  We apparently have Saturn-envy as we attempt to create rings around our planet.

You’ve got to feel bad for countries like Chile, who used to have a single working satellite in orbit, but the warranty ran out and it doesn’t function anymore.

View the high-resolution image on Flickr.