About
Randy Krum
President of InfoNewt.
Data Visualization and Infographic Design

Infographic Design

Infographics Design | Presentations
Consulting | Data Visualizations

DFW DataViz Meetup

Join the DFW Data Visualization and Infographics Meetup Group if you're in the Dallas/Fort Worth area!

Search the Cool Infographics site

Custom Search

Subscriptions:


Feedburner

The Cool Infographics® Gallery:

How to add the
Cool Infographics button to your:

Cool Infographics iOS icon

- iPhone
- iPad
- iPod Touch


Read on Flipboard for iPad and iPhone

Featured in the Tech & Science category

Flipboard icon

Twitter Feed
From the Bookstore

Caffeine Poster

The Caffeine Poster infographic

Entries in visual (320)

Wednesday
Jun162010

Facebook's Secret Strategy Infographic

Art: Audrey Fukuman

There was some controversy when Facebook CEO Mark Zuckerberg unintentionally revealed the 2010 Facebook Strategy Infographic that was printed on the inside liner of his hoodie at the D8 conference.  Audrey Fukuman at SFWeekly.com has recreated the infographic based on the video and photos.

Photo via AllThingsD/Anna Mathat

According to SFWeekly.com, this was a hoodie given to all Facebook employees.

I expect some disagreement, but I’m a firm believer that you can absolutely design an infographic to represent a strategy, a concept or a qualitative result.  Infographics don’t have to be based only on a massive amount of quantitative, numeric data.  What do you think, does this qualify as an infographic?

Here’s the video clip from the AllThingsD D8 conference when Mark removed the hoodie and revealed the graphic:

Found on SFWeekly.com and digg.com

Thursday
Jun102010

A Cool Interview with Nathaniel Pearlman (infographic designer)


With the release of the Visual History of the American Presidency last week, I asked Nathaniel Pearlman, infographic designer and President of Timeplots, LLC, if he would be willing to do a short interview.  Nathaniel was nice enough to answer a few questions about his infographic design process and his projects.

Nathaniel started the company in May 2009 and released the Visual History of the Supreme Court of the United States (SCOTUS) (which you see above) as their first infographic poster. 

Here’s the interview with Nathaniel:


Cool Infographics: What software applications do you use for the Timeplots posters?

Nathaniel Pearlman: So far we have programmed our graphics in the R language and done some final design work in Illustrator. I’m interested in hearing about other platforms to use for complex data and layout — especially other software applications that would allow us to create interactive and print versions from the same code base.


Cool Infographics: Can you describe your design process?

Nathaniel Pearlman: We start by asking ourselves what an informed audience would want to know about the subject we’re tackling. For example, for the presidential print, we asked ourselves, “Why is each president important? Why should people care about these guys? What is measurable about the context in which they served, and how could we show that?”

Then we go through a data collection phase: we take some time to see what data has already been collected on the subject, we catalog sources, and then we obtain data (and rights, if necessary) for the information we need. We wait until we have the hard data and have examined it and visualized it in several ways before we settle on what stories we can pull out of it.

The primary phase of the design process is iterative – there is a lot of trial and error. For example, we programmed (and scrapped) several major design ideas for our Senate print before settling on the current version. It turns out that our process is longer and more involved than I expected. Each print thus far has taken many months of data collection, design, and review. We also included quite a number of reviewers into our design process, folks with substantive expertise and designers as well.


Cool Infographics: What’s the most interesting thing you learned from the data?

Nathaniel Pearlman: I like the big picture: for me, the presidential print shows a historical view into the sweep of U.S. history — a marked contrast with the more journalistic, and immediate, take on the political and economic state of the nation that we are used to seeing in the news. It lengthened my perspective on current events, and I hope that it does so for those who purchase the print.

When you see the entire span of U.S. history visualized in just a few feet of space, you see the economy bouncing up and down, the parties jockeying back and forth, the budget bumping along. The ups and downs then seem fairly routine from this perspective, especially when compared to the sensationalism of our daily headlines. The other thing that really stands out is the growth of the country since 1789, both economically (in real GDP) and in population. As to the small picture: I love seeing details of each election — what percentage of the vote did Strom Thurmond get in 1948, for example, and which states did he win — so we tried to put each election into context with a scoreboard and electoral cartogram wrapped around the curve of party control of the executive.


Cool Infographics: What was the hardest part behind designing the Presidential poster?

Nathaniel Pearlman: When you see a finished product like ours, what you miss are the hundreds of decisions that were labored over as it was created. For me, the most difficult thing is deciding when I’m done. Every time I look at a new draft, I have ideas for changes that could be made. At some point I have to say “enough is enough; we are done.” The other hard part is writing the text that’s included on the print.. just crafting short explications of each presidency is difficult.


Cool Infographics: Where are some of your favorite places that have the SCOTUS poster on display?

Nathaniel Pearlman: We are happy that the U.S. Supreme Court library displays a framed print, and the gift shop in the Supreme Court building itself carries the print. We’ve also seen many purchases by legal luminaries — we’re not legal experts ourselves, so it’s nice to see that the experts appreciate our work. A son of a current justice bought one. Also, many high school teachers from across the country have purchased prints for their classrooms (we offer discounts for educators); it’s great to see teachers showing interest in using data visualization as an educational tool.


Cool Infographics: Where do you have the posters printed, what are the printing specs and why? 

Nathaniel Pearlman: We shopped around quite a bit for a printer, because we are fussy about the results – we wanted the quality of the paper to top-notch, we needed relatively fast turnaround and reliable fulfillment, and we wanted the printing process to be environmentally friendly — all of this, of course, at an affordable cost. We currently offset-print the posters in Maryland, at Whitmore printing, and they also do our fulfillment. (Ideally, we would like to find an affordable on-demand printer who can handle our large-scale posters and fulfillment. If we found this, we would be able to sell shorter-run prints; please send me any suggestions!)


Cool Infographics: Would you share some thoughts on running a business selling infographic posters?

Nathaniel Pearlman: I am enjoying Timeplots. As a profit-generating business, it is not for the faint-of-heart. I am lucky to have some time and space to try it, but it is unlikely to run in the black for quite some time. My first company, NGP Software, Inc. (www.ngpsoftware.com) is doing well and allows me to do this on the side.


Cool Infographics: How has the Timeplots On Demand side of the business been going with private clients? 

Nathaniel Pearlman: We’ve really enjoyed working with people who aren’t necessarily familiar with data visualization — everyone who we’ve worked with has been more than happy with the results. So — if anyone reading this has a project in mind, or if you want us to create a visualization for you or your institution — let us know!


Cool Infographics: How did the process of using Amazon Mechanical Turk for proofreading work for you?

Nathaniel Pearlman: Mechanical Turk is a good method for crowd-sourcing some kinds of work. We’ve used it for three separate projects now — twice for proofreading, and once for fact-checking research. We have gotten more hits than misses, so it’s been worthwhile. Eliza manages that process and has been impressed by the level of work she has received. The Mechanical Turk worker community (“turkers,” as they call themselves) are serious about their work, and it shows. In a couple cases, a “turker” found an error that we all missed: for example, when we posted the presidential print for proofreading, one turker pointed out that we listed Vice President John C. Breckinridge as “Breckenridge,” clearly misspelling his name. Another turker noted that we had described President Taylor as dying “halfway” through his term, when in fact it was a few months prior to “halfway.”


Cool Infographics: What should we expect in the future from Timeplots?

Nathaniel Pearlman: We have a rough list of fifty or sixty more projects we would love to do. After we launch the Senate print, we will decide what is next. I would love to hear from your audience what they would like to see, and we are always looking for collaborators, if someone would like to work with us on a project that they care about. We’re always open to new ideas!


Friday
May212010

Visualizing Alcohol Use

From phlebotomist.net (a website all about blood!), the highly-colorful Visualizing Alcohol Use infographic explores the effect of alcohol 

How much alcohol can your bloodstream handle? Take a look at the graphic to check out everything from blood alcohol averages to the highest blood alcohol content ever survived (you won’t want to try this at home).

There’s no designer credited, but if this wasn’t designed by EJ Fox (@pseudoplacebo) then it was heavily influenced by his work.

Thanks to Cate for the link!

Tuesday
Apr272010

10 Tips for (journalists) Designing Infographics

This article was originally published on “Digital Newsgathering”, a class blog for Journalism 226 at San Francisco State University, Instructor: Staci Baird.  I wrote this post as a guest author, and with permission I am republishing it here.


Assuming you’re not working for a media corporation with huge graphics and statistics departments at your disposal, you may want to create some infographics for your own articles.  With today’s flood of information, infographics allow readers to quickly digest and understand complex data.  A good infographic will not only inform readers, but will also create interest and convince people to read your article similar to how good headlines and photos attract readers.  In contrast, both boring and overly complex graphics will quickly convince readers to ignore your article.

Here are 10 tips for designing better infographics (click the images to go to their original sites):


1) Be Concise: Design your infographic to convey one idea really well.  You’re not writing a scientific research paper, so don’t expect your reader to dig into a lot of detail.  This doesn’t mean you should only visualize one number, but your entire graphic should support one of the major points from the article.  You can include additional facts or information to make the infographic stand on its own, but don’t lose sight of the point you want to get across.

This example is an infographic poster I created about the caffeine content in drinks.  At this size, you can easily tell which drinks have more or less caffeine, and if you decide to view the higher-resolution image you can dig deeper into the details and additional information that’s included in the poster.

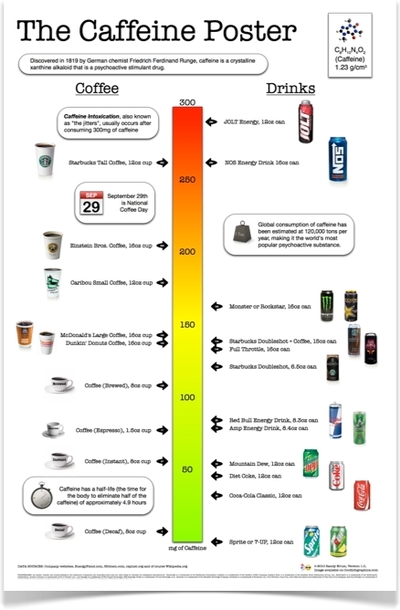
The Caffeine Poster, by Randy Krum


2) Be Visual:  Design your infographic with your final for viewing size in mind.  A number of articles online require the viewers to click on a text link to view the graphics that accompany an article, and I believe this is a huge mistake.  Design your graphics to be viewed in-line with your article.  There’s nothing wrong with allowing viewers to click the image to see a high-resolution version, but they should be able to understand the image when viewed with the article.  A side benefit is that a viewable image also allows for readers to share the image by itself on social media sites easily.

Google PageRank Explained, by Elliance


3) Be Smarter:  Build your data and explanation right into the infographic, and don’t make your readers have to work hard to understand what they’re seeing.  Your infographic shouldn’t need a legend to be understandable, and there’s no reason to ask your readers to keep moving their eyes back and forth between the chart and the legend to understand the graphic.  Treat your readers as intelligent and make your graphic look professional by including the relevant descriptions and numbers in the infographic.

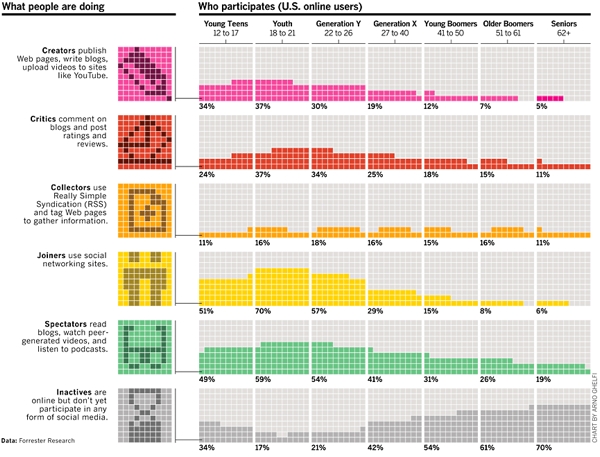
Who Participates Online?, by Arno Ghelfi for Wired Magazine


4) Be Transparent:  Infographics can be used to lead readers to the wrong conclusions.  Always cite your data sources and allow readers to dig deeper into the data if they have the desire.  Some of the best articles include easy access to the source data with links to a spreadsheet for readers to view on their own.

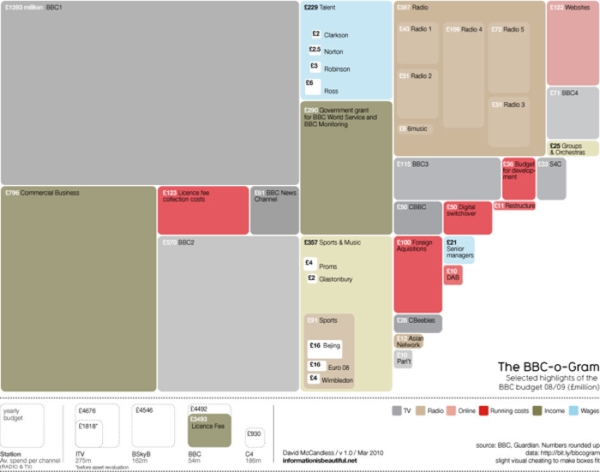
BBC Budget, by David McCandless

See the visual. Explore the data.


5) Be Different:  If you can avoid it, don’t use a bar chart, a line chart or a pie chart.  This infographic of visualization styles is a great resource to help determine a good visual to use for your data.  The different styles are grouped together by the type do data they are trying to communicate and in the interactive version, an example is shown as you mouse over each style.

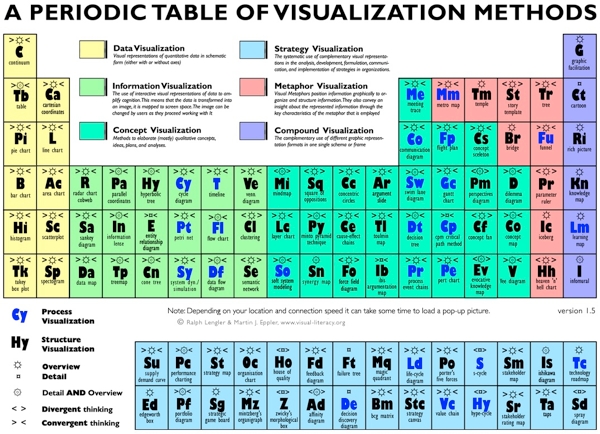
Periodic Table of Visualization, by Visual-Literacy.org


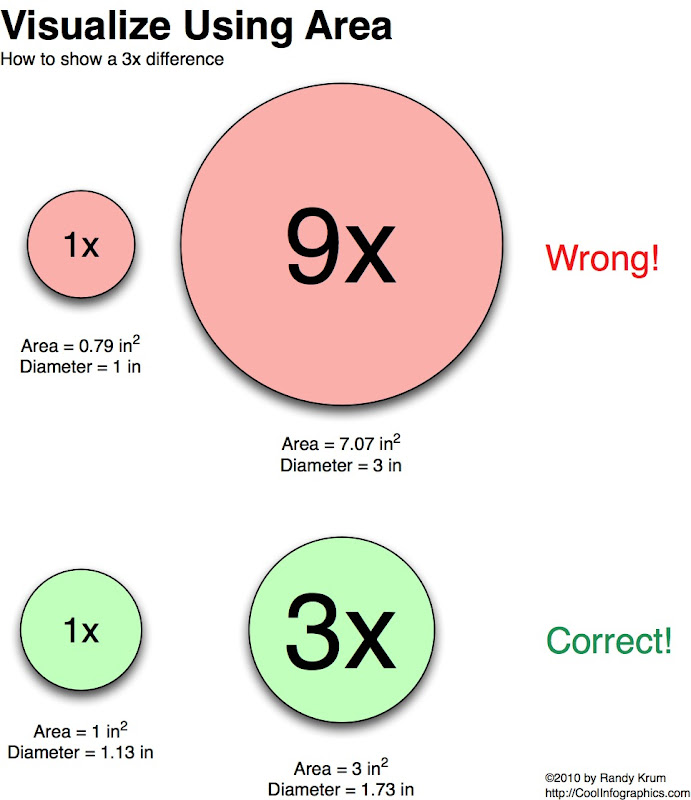
6) Be Accurate: Remember your geometry and visualize differences using area.  When trying to convey the scale of your data, many graphics use different sized shapes or images to show amounts relative to each other.  The reader’s eye sees the total area of the image as indicative of scale, not just the height of the image. 

For example, if you’re using circles to show one number is 3 times larger than another, the area of the circle must be in proportion to the values being represented.  If you make the mistake of making the diameter of the circle 3 times larger, the area is actually 9 times larger.

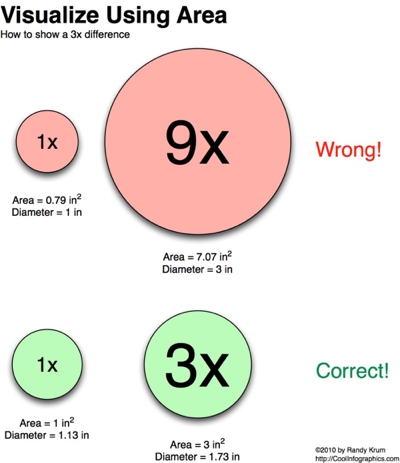
Circle Areas, by Randy Krum

The infographic below breaks down the number of FedEx trucks using the area of the circles in a mind map style image.  This could have been a simple bar chart, but it’s much more visually appealing as a bubble mind map.

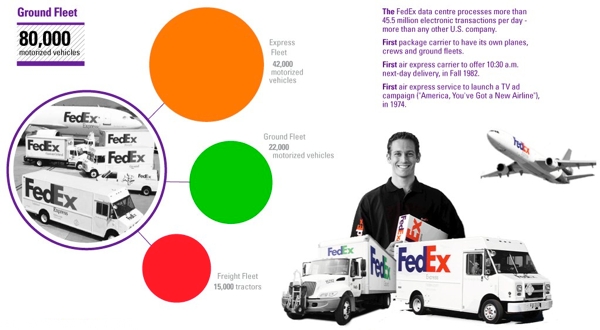
The Fedex Universe, by Robin Richards for MeetTheBoss.tv

NOTE: One common exception to this is a standard bar chart.  No matter how wide the bars are, the height is the only dimension that conveys meaning.


7) Be Attractive: Include visuals:  Illustrations and photos included in the infographic make a big difference.  Even though this example is a bar chart, the inclusion of the company logos make it quicker and easier for the reader to understand.

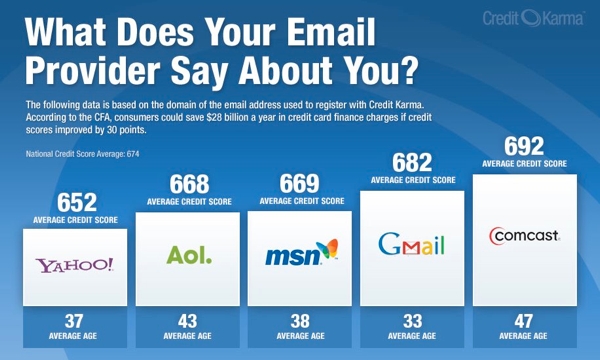
What Does Your Email Provider Say About You?, by CreditKarma.com


8) Be Varied:  Find a good visual style that’s right for the data you’re trying to share.  If your data is about countries, plot it on a world map not a bar chart that lists countries.  Also, don’t be afraid to mix visualization styles together in one infographic.  

This example infographic by Emily Schwartzman about the aftermath of the earthquake in Haiti won a design contest from GOOD Magazine, and mixes map data with a stacked bar and colored boxes for percentages.  This is also a great example of viewing size.  You can see and understand the visuals, but the actual numbers are available if you view the high-resolution version.

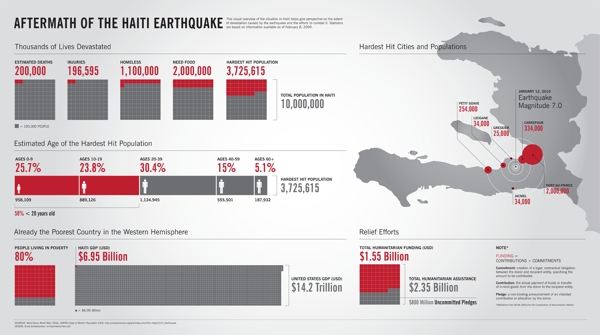
Haiti Earthquake Infographic, by Emily Schwartzman


9) Be Gracious:  Work on the assumption that your infographic may be viewed or shared without the article you originally designed it for.  Make sure that the final graphic includes the following pieces:

  • Copyright, to be explicit about any rights and terms of use
  • Source data, so anyone can check your facts
  • Designer’s name, always give credit to the artist/illustrator/programmer/designer
  • Original image/article address, so anyone who sees the image can find your original article


10) Be Creative:  Use whatever tools you have available to create your infographic.  Of course, the tools you use will depend on what you are trying to visualize.  Many infographics can be created using simple applications like a vector drawing program (like OmniGraffle or Microsoft Visio), a charting program (like Microsoft Office or Apple iWork) or an image editing program (like Adobe Photoshop).

Here are some visual tools available on the Internet: 

Thursday
Apr152010

The Feltron Annual Report 2009 and an Online Class April 29th

I’m not sure how it slipped off the radar, but I haven’t posted a link to the Feltron Annual Report 2009 here on the blog yet.  Nicholas Feltron has done infographics for Time, CNN, Wired, New York Times, Fast Company and more, but probably his most popular infographics are his annual reports.  The print version of the Feltron Annual Report 2009 is available for pre-order for $30 from the Feltron Store.

Mike Aruz interviewed Nicholas Feltron when the 2009 Annual Report was released on mikearauz.com

The reason this came up today is that Nicholas is going to be the host of Live DesignCast: Nicholas Felton, A Master Class on Information Design.  This is an online class from PRINT Magazine on April 29, 2010 at 4pm EST.  The class costs $69 and is one hour long.

Our current information age has produced an inevitable crush of complicated data to sort through. Thankfully, there is a rising group of designers who present all this data in a way that we can understand and use. And for the last several years, no one has done it better than Nicholas Felton. 

In this Master Class, Felton explains how detailed data leads to better stories, offers a few guidelines for displaying complicated data sets, and challenges you to use all five senses through the process. 

In this Master Class DesignCast, you’ll learn: 

• How to visualize large data sets
• How to go from an initial question to gathering, comparison, and display 
• How to use sensors, whether hardware or software, to gather data
• How data helps satisfy curiosity, provides insight, and entertains
• How better data leads to better stories

Tuesday
Apr132010

An Infographic Evolution of the Bra

This two-panel infographic on the Evolution of the Modern Bra was designed by Suzi Slavik for an assignment in her information graphics class at Ohio State University.

The first panel is devoted to social influences, industry leaders, and shifts in fashionable silhouettes. The second panel discusses historical milestones, significant fabrics used, and the bra fitting procedure.

The assignment was to choose any sequence, cycle, or evolution and represent it graphically. The information was to be presented in two separate panels that were related but could also function independently of one another.

Thanks to Matt for the link!

Monday
Apr122010

Diving the Depths - a really deep infographic

I love how this infographic, Diving the Depths, defies the standard paper or poster size to get it’s message across.  I’m really not a fan of the recent trend towards really tall infographics without purpose, but here the tall banner style actually conveys meaning.  Infographic designed by Big Oak Studios.

Found on Infographics Showcase, a great site that also highlights some of the best infographics from the web.

Thanks to Shell for the link!

Friday
Apr092010

An Infographic About Making an Infographic...

An infographic from Brandon Oxendine showing how his time is divided between activities when working on designing an infographic.  Brandon, try spending more time drooling…

You can see more on Brandon’s blog.

Thursday
Apr082010

The Ford Fusion 41 Competition infographic

As part of the advertising behind the Ford Fusion, Ford held a contest with eight teams to break some wacky world records.  Tapping into the public interest in infographics, they worked with designer Thomas Porostocky to develop a visual design they could publish.

The Fusion 41 competition amassed a wealth of raw data generated from all of the teams and activities. To bring these numbers to life we handed the database over to designer Thomas Porostocky who spun it into some amazing poster size visuals. Download the PDF to check out the Fusion 41 stats in their full glory.

This infographic has received some criticism on the web, so I thought I would add a few more comments.  I love the idea that Ford has taken some wacky, strange and funny statistics and visualized them to make them interesting and approachable by viewers.  The results from competitions like “Fastest time to plant a tree”, “Most ‘backseat driving’ comments in 10 seconds” and “Refrigerator magnets stuck to a Ford Fusion” help support the idea that it’s not all serious and the Fusion can be a fun car.  I think the statistics behind the competition are very well focused to be humorous and entertaining to the customer profile that Ford is trying to reach.  I like the grid and speedometer design portions of the poster a lot.

We’ve told the world that the Ford Fusion is up to and up for any challenge. So we chose eight Fusion drivers and their friends to put the Fusion to the test. Every 41 hours for three weeks we tasked these teams to rack up the most points by completing activities with a 2010 Fusion. During those 3 weeks the teams strove to out-score each other across 12 separate activities.  In the end, the team leading in the most Activities walked away with the title of Fusion 41 winner and a Ford Fusion of their own.

I only have two complaints about the infographic myself.  First, I don’t like the over-use of bar charts.  It reminds me of the pages of bar charts that many corporate reports have that could be replaced by a good infographic.  Second, the bright colors used are harsh to the eyes and hard to read.

In December, Ford teamed up with 8 loyal Fusion owners and 4 of their friends to compete in relay challenges that set world records in the 2010 Ford Fusion. Fusion 41 activities included the most turkeys donated to a food bank, most clothes donated to a shelter and most people dancing to the Fusion’s stereo to name a few. The teams had a blast participating in the Fusion 41 program and the results were remarkable!

Take a look and post your thoughts in the comments.  What do you think?

Wednesday
Apr072010

Prostate Cancer infographic

The Conversation” is an infographic about prostate cancer by designer Mike Wirth.  Mixing a few key statistics and visualization styles, I like that this infographic includes related illustrations, charts, relevant text explanations, the key numbers and a map.

Nice job Mike!