About
Randy Krum
President of InfoNewt.
Data Visualization and Infographic Design

Infographic Design

Infographics Design | Presentations
Consulting | Data Visualizations

DFW DataViz Meetup

Join the DFW Data Visualization and Infographics Meetup Group if you're in the Dallas/Fort Worth area!

Search the Cool Infographics site

Custom Search

Subscriptions:


Feedburner

The Cool Infographics® Gallery:

How to add the
Cool Infographics button to your:

Cool Infographics iOS icon

- iPhone
- iPad
- iPod Touch


Read on Flipboard for iPad and iPhone

Featured in the Tech & Science category

Flipboard icon

Twitter Feed
From the Bookstore

Caffeine Poster

The Caffeine Poster infographic

Entries in visual (320)

Thursday
Jan282010

Circular Browser Statistics using Axiis

Michael VanDaniker posted this Historical Browser Statistics visual as part of the launch of Axiis, including the detail about what it took to develop this visual.  At its root, this is a timeline that starts at the center (January 2002) and works outward to the outer ring that represents the most recent time slice (August 2009).  Each ring is a stacked bar showing the portion of browser usage.

Each of the concentric rings are essentially pie charts showing the percentage of visitors using each browser for a particular time slice, starting with January 2002 in the center and working out to August 2009.  The numbers on W3schools.com don’t quite add up to 100% because they don’t report on browsers that make up less than 0.5% of their visitors.  This results in a gap at the end of each ring.

I don’t know much about Axiis (yet…), but its a new, open source framework for data visualizations.

Thanks to Les (@lesjames on Twitter) for the link!

Tuesday
Jan262010

Caffeine and Calories

Check out another great caffeine infographic, The Buzz vs. The Bulge, by David McCandless from Information Is Beautiful.  Another great spin on caffeine in drinks, this one plots caffeine content on the X-Axis, and calories on Y-Axis.

I love that there are also some foods mixed in with the drinks like a dark chocolate car, a butter croissant and coffee ice cream (brilliant).

When I started working on my Caffeine Poster, this hadn’t come out yet.  One the reasons I choose caffeine as the data to visualize for my project was because there weren’t any good visuals to be found at that time.  I definitely wanted to acknowledge David’s great work.

Tuesday
Jan192010

6 Twitter Topic Visualizations for "Caffeine Poster"

The Caffeine Poster got a huge amount of traffic, specifically on Twitter, so I thought this would be a good chance to share a collection of the available, interactive twitter visualizations.  Although there are many visuals that show a Twitter user’s network of connections, these are visualizations that show conversations based on the search topic “caffeine poster” on Twitter.

SocialCollider.net, by Karsten Schmidt and Sascha Pohflepp, maps the connections within a conversation starting with a Twitter stream or search topic.

This experiment explores these possibilities by starting with messages on the microblogging-platform Twitter. One can search for usernames or topics, which are tracked through time and visualized much like the way a particle collider draws pictures of subatomic matter. Posts that didn’t resonate with anyone just connect to the next item in the stream. The ones that did, however, spin off and horizontally link to users or topics who relate to them, either directly or in terms of their content.


The Twitter Streamgraph from Jeff Clark at Neoformix.

The StreamGraph shows the usage over time for the words most highly associated with the search word. One of these series together with a time period are in a selected state and coloured red. The tweets that contain this word in the given time period are shown below the graph. You can click on another word series or time period to see different matches. In the match list you click on any word to create a different graph with tweets containing that word. You can also click on the user or comment icons and any URL to see the appropriate content in another window. If you see a large spike in one time period that hides the detail in all the other periods it will be useful to click in the area to the left of the y-axis in order to change the vertical scale.


Cloud.li, by Elbert F, creates a word cloud based on your search terms.


Trendistic will plot the tweet volume on a timeline based on your search terms.  You can click anywhere on the timeline to see the specific tweets for that time too.

Trendistic is a tool that allows you to track trends on Twitter, similarly to what Google Trends does for Google searches. It gathers tweets as they are posted, filters redundant ones and compiles the rest into one-hour intervals.

This way, it shows how the frequency of one, two, three and four-word phrases fluctuate over time. The result is a visualization of what is popular and what is not among Twitter users, and how certain events are reflected or even predicted by themicroblogosphere.

You can enter a phrase (topic) in the 
Trendistic search box to see how its frequency varies over time, or several different topics separated by commas to see how they relate (each topic will show in the chart with a specific color): try comparing ‘dinner’ and ‘breakfast’ or ‘morning’ and ‘night’ for instance, to see how powerful it can be. 


TwitterFall shows you the tweets based on your search term, and presents them as an animated waterfall.

Twitterfall is a way of viewing the latest ‘tweets’ of upcoming trends and custom searches on the micro-blogging site Twitter. Updates fall from the top of the page in near-realtime.

For popular trends, Twitter is queried from the Twitterfall server, and results arepushed to your browser, rather than your browser doing the queries, or your computerpolling our server repeatedly. This means using Twitterfall for popular trends is nicer on Twitter than other services.


 TwitRadar.com will map out a search term, a user or a hastag into a handful of different visuals.

Google Translated from Portuguese: The TwitRadar is a tool for monitoring Twitter. With TwitRadar you can track, monitor and share real-time, the subject you want. Just type the tag you want to track, the TwitRadar show, very simple and intuitive, all that is written about it on Twitter. And not to be confused with the volume of information tracked, the TwitRadar organizes the results according to the criteria that you want.

Monday
Jan182010

The Electromagnetic Spectrum - infographic comic

I recently found a great old infographic from xkcd.com visualizing the Electromagnetic Spectrum.  Check out the detail in the larger version on the xkcd site.

Friday
Jan152010

Making-Of The Caffeine Poster - Part 1

As much as I love infographics, I’m not a graphic designer.  I’ve created a number of graphics for my corporate jobs, but they always deal with confidential information so I can’t share those on the blog.  Up until now, all of the graphics I’ve posted about on Cool Infographics are the work of great designers around the world.  Recently, I decided to try my hand at creating one of my own to share with everyone.

If you follow me on Twitter (@rtkrum), you may have read that I started on this back in June 2009.  I haven’t had much time to spend on it, so it definitely took longer than I originally thought.  I want to share some of the decisions and solutions I came across during the process, and maybe it will help anyone reading this when they work on their own infographics.

You may say, “This is such a simple graphic, why did it take 6 months?  It looks like it should be pretty easy.”  First, I would say that I wasn’t working on it full time, but I think the exercise also highlights how much work really goes into infographic designs.  It’s not a new sentiment, but let me say that designers don’t get enough credit.


What should the infographic be about?

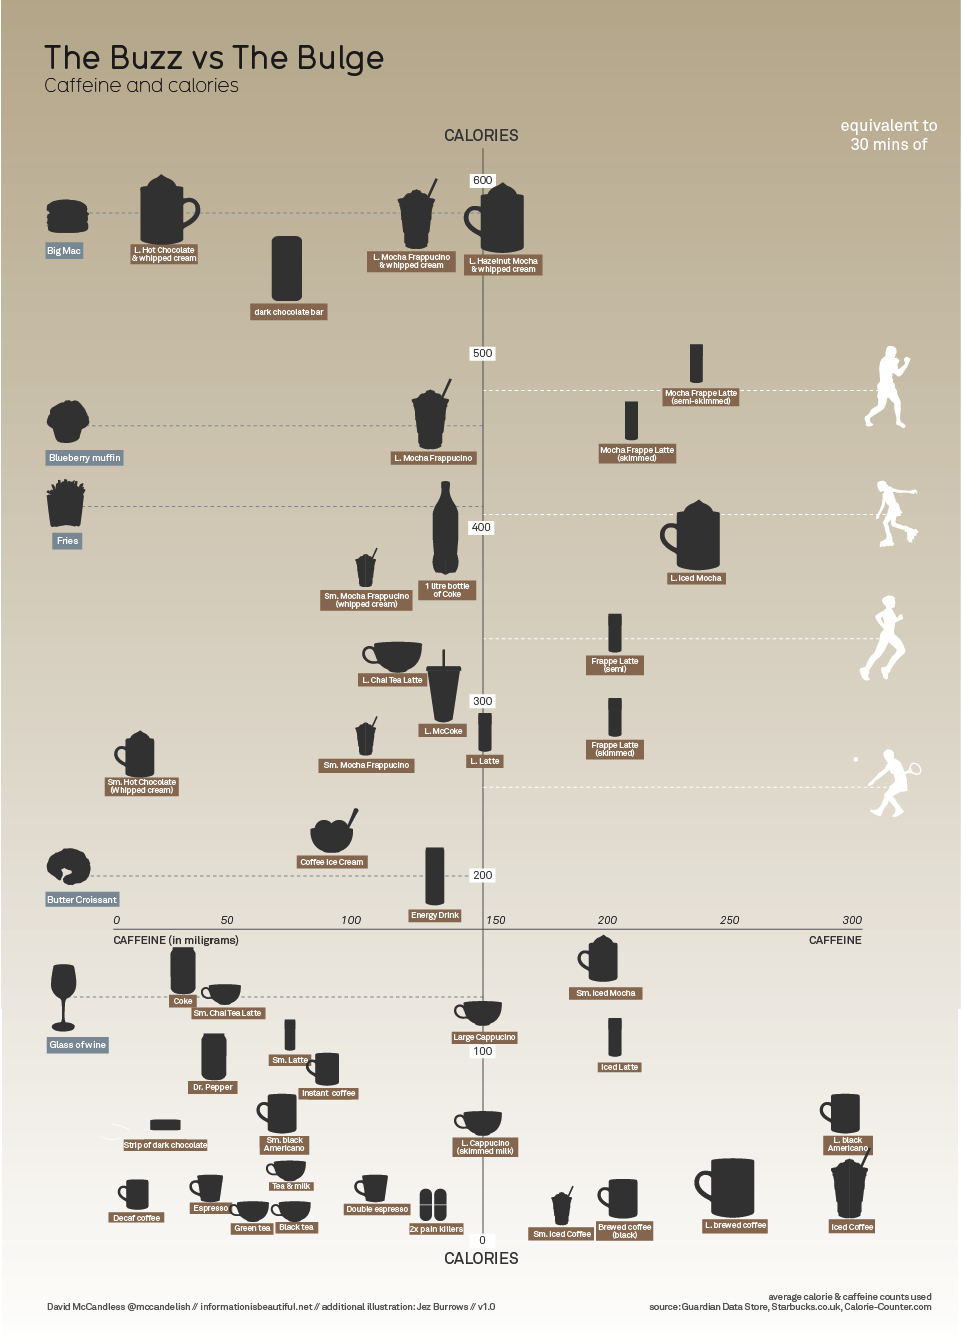
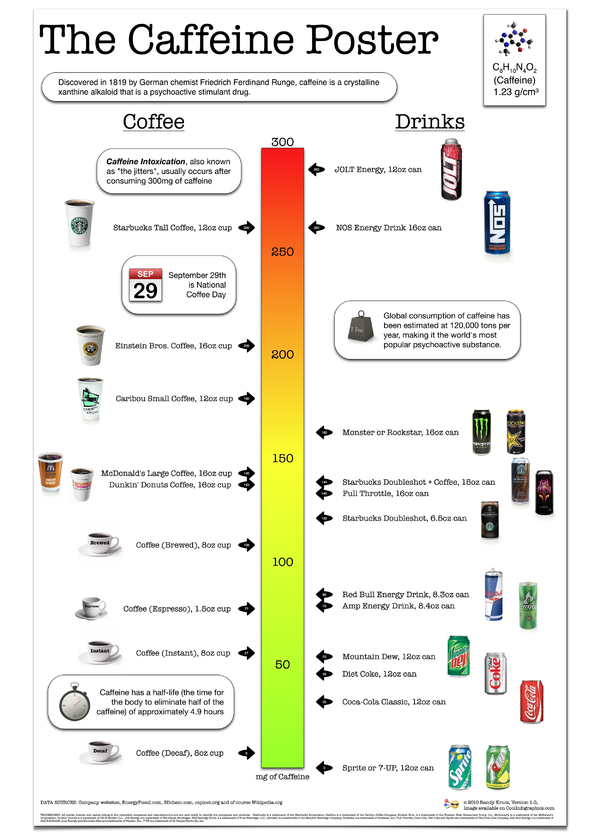
Of course the first question I had to tackle was what should I create an infographic about?  I wanted to find something that had a lot of publicly available data, but also a topic that hadn’t already been covered by a bunch of other graphics.  A topic of interest to a lot of people, so the audience for the infographic would also be large.  I liked the idea of caffeine content because although the data is available online, it’s not included on the government regulated Nutrition Facts on drinks.  Very few companies add it voluntarily, but for the most part you have to go find the data on your own.

Also, the data available online was predominantly text figures, so you have to scroll through pages of information to find the drink you’re looking for.  This combination of hard to find data, and hard to decipher once you find it made for a good topic.


How to calculate the data?

I created a simple spreadsheet to massage the data, and there were two ways I could have calculated the caffeine content.  Either total caffeine content (mg), or caffeine concentration (mg/oz).  Although caffeine concentration would be a good common denominator to compare drinks, it doesn’t capture how much you consumer when you actually purchase a drink.  Most of these drinks don’t come from a dispenser where you could choose how much you wanted to drink.

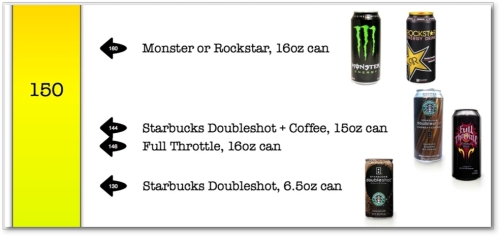
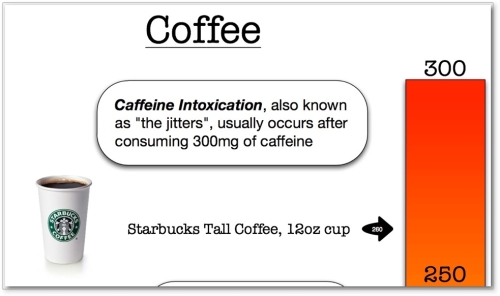
For example, the Starbucks Doubleshot is a very high concentration (20 mg/oz), but it comes in a 6.5oz can.  Therefore you only get 130mg of caffeine when you drink a can.  Compare that to a McDonald’s Large Coffee that has a lower concentration (9 mg/oz), but comes in a 16oz cup for a total of 145 mg.

Ultimately, I decided to visualize the consumer friendly version that would should how much you get when you make a purchase decision, and went with the total caffeine content.


What type of visual should I use?

The scale was the obvious choice to show the relative content of the drinks.  Back in June, I started with a very simple sketch in my Moleskine.


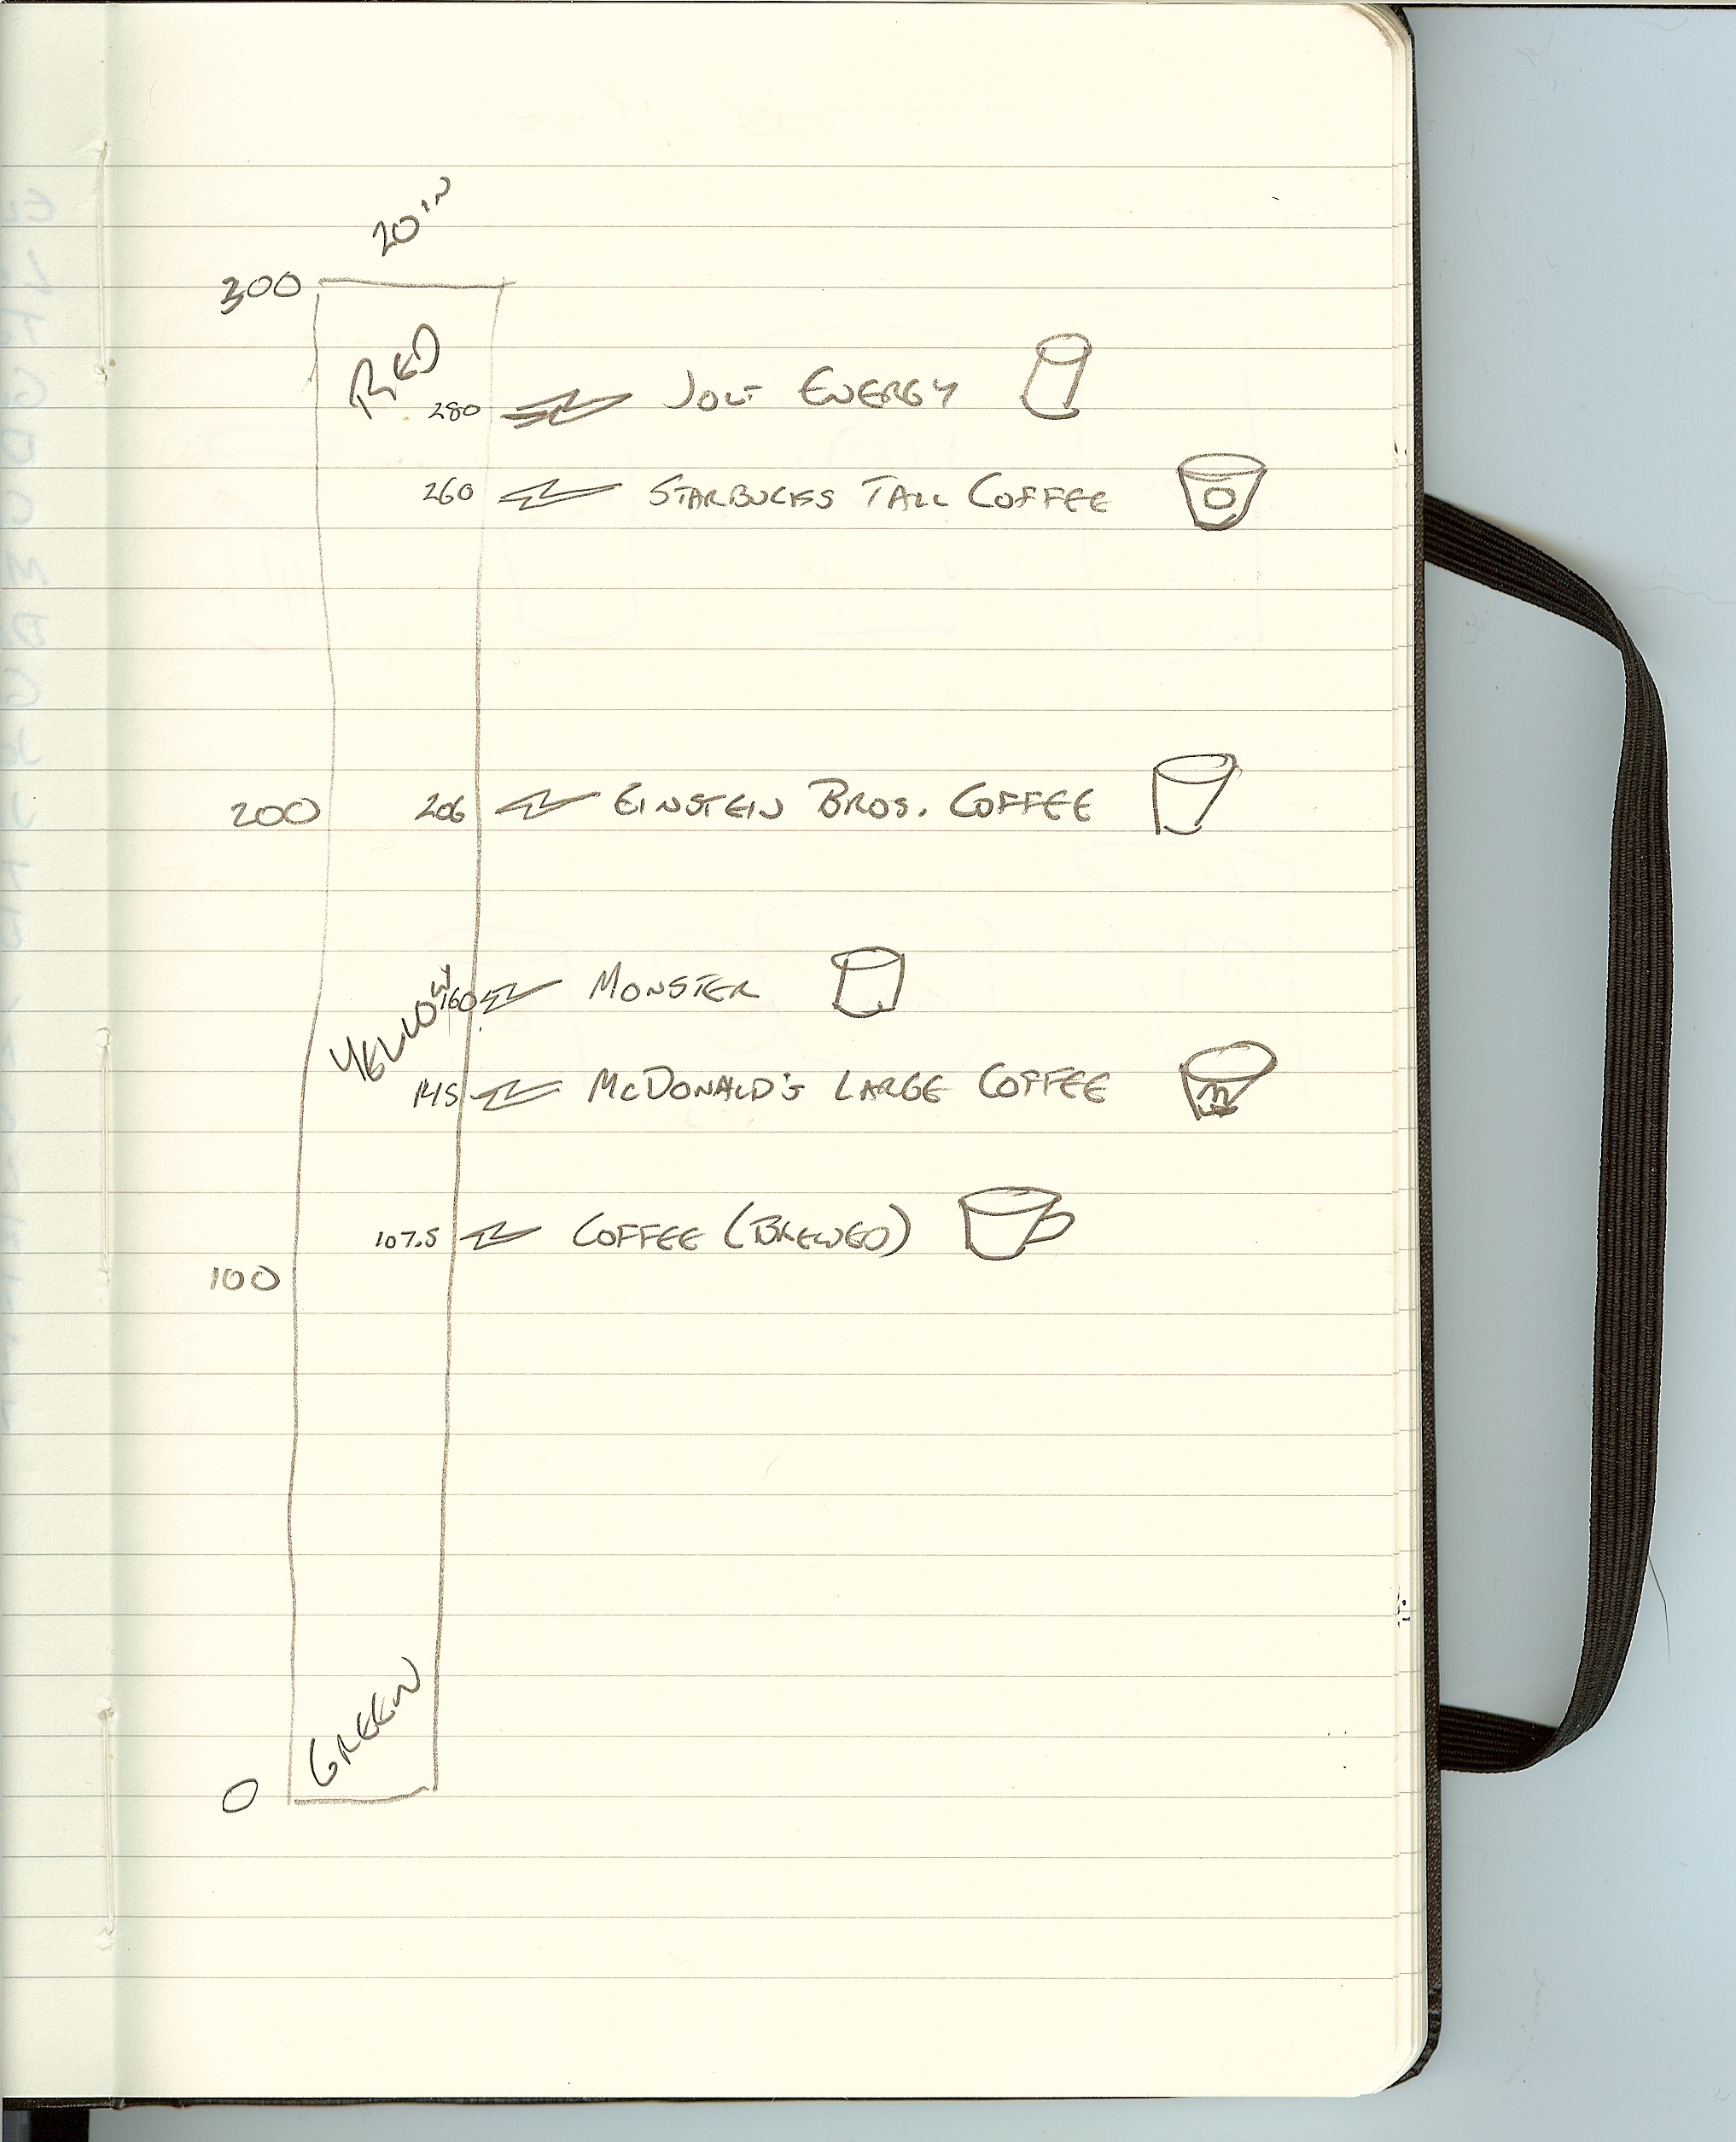
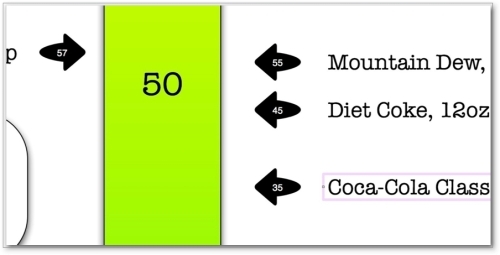
Because there are so many drinks in the lower half, my original design thought had a closeup of the 0-100mg range.  Here’s an early working version:

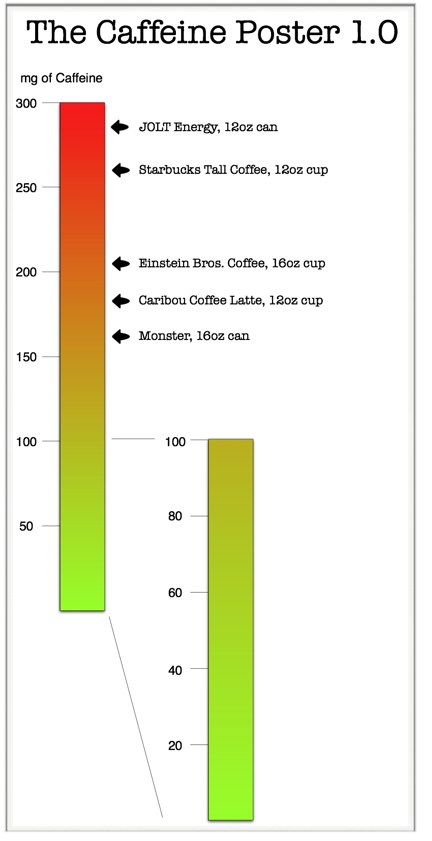
I didn’t like how this looked, or how much dead space in the post this would create.  So ultimately I ended up significantly cutting down the number of drinks I could include, and moving the scale to the center so I could include drinks on both sides.

You’ll also notice how muddy brown the yellow in the middle of the scale looks in these old images.  I later figured out how to do a 3-color blend instead of just a 2-color blend from red to green.


What software did I use to create the poster?

This is easily the most asked question I hear about any infographic.  I use a Mac, and really only used a small number of applications.  Here’s a list of the software packages I used:

  • OmniGraffle Pro 4.2.3 - Overall layout and creation of the final image
  • Pixelmator 1.5 - Image editing
  • Keynote 5.0.3 - Used for image editing and alpha masks
  • Numbers 2.0.3 - For the data calculations

 I will add that one of my best friends is an art director, and she helped clean up a few of the photos using Photoshop and Illustrator.  A huge “Thank You” to Steffani for her help.


More to come…

Making-Of The Caffeine Poster - Part 2

Thursday
Jan142010

Video - Designing for Visual Efficiency

Ignite Toronto 2: Ryan Coleman - Designing for visual efficiency from Ignite Toronto on Vimeo.

Short but good presentation from Ryan Coleman, the Chief Community Evangelist at VizThink!

Just reading this description unleashes a complex process to help your mind understand what your eyes are looking at. Together, our brain and eyes run through these processes millions upon millions of times daily, all without us even being aware of it. “Designing for Visual Efficiency” looks at the process of how we see and how that knowledge allows you to create designs that are visually efficient.

Ryan Coleman is an entrepreneur, facilitator and information designer from Toronto, ON. Through interactive workshops, facilitated sessions and/or consulting projects Ryan works with clients to organize and refine their ideas and shape them into a common vision that they can act on and share clearly, concisely & consistently. Ryan is also a founding member and Chief Community Evangelist for VizThink, a global community of visual thinkers & practitioners.


Thursday
Jan142010

The Visual Miscellaneum - Win a Signed Copy!


First of all, The Visual Miscellaneum is a great book of infographics by David McCandless.  


Second, and more importantly, it has sold out in the U.S.  Amazon, Barnes & Noble, Borders and others all show the book to be Out Of Stock.  David has what are potentially the last five copies of the first edition, and he is going to sign them and give them away for free.


Visit David’s site, Information is Beautiful, (you should bookmark his site while you’re there) and post a comment ON HIS SITE under his entry about the last five books.  On Saturday, January 16th, David will choose five people from the comments to receive the free signed copies.


Monday
Jan112010

The Caffeine Poster, How Much Caffeine Are You Drinking? [new infographic]


You are what you drink.  With so many drinks today claiming to be “energy drinks”, I wanted a little visual clarification, so I made The Caffeine Poster.  With coffee drinks on one side and canned cold drinks on the other, you can quickly see how much of a caffeine “hit” (in mg) you will get after consuming.  What’s especially interesting is many of the drinks have a very high caffeine mg/oz ratio, but the drink is so small you don’t get that much total caffeine.


I’ve been working on my own infographic for 6 months now off-and-on when I can make time.  I figured that I’ve been running this infographic blog for a few years now, it’s time to start putting up my own work.  Most of the data visualization I’ve designed are confidential to the company I make them for, so I wanted to create some infographics that I can publish on the blog.


The Caffeine Poster is supposed to help with one decision in your life.  If you’re going to grab a caffeine drink during the day (or evening), which drink should you consume?  I tried to stay focused on telling one story really well.  I’ve heard from others that this may make for a really good infographic, but may not make a great poster because a good poster would have a much deeper level of detail.  I like it, and we’ll see what king of responses I get.


I absolutely want to hear your feedback.  Please add your comments below or send me a note.  What do you think?  I’ve also got requests to print and offer this as a poster.  We’ll see if there is enough interest…

Also, I’m planning to post as “Making-of” article on what it took to create this infographic.


Making-Of The Caffeine Poster - Part 1

Making-Of The Caffeine Poster - Part 2

Making-Of The Caffeine Poster - Part 3


THANKS: A big thanks to Fast Company for posting about The Caffeine Poster on the Fast Company blog.  The Caffeine Poster was the most popular story of the week on Fast Company! 


You are what you drink!

Wednesday
Jan062010

Chart Wars: The Political Power of Data Visualization

Chart Wars is a great, short (5:15) presentation by Alex Lundry on the political power of data visualization and some of the issues surrounding using charts and infographics to promote a specific agenda.  Inspired title slide too.  Nice job Alex!

TargetPoint’s VP and Director of Research, Alex Lundry, was recently a featured speaker at DC Ignite, an evening of short presentations in which participants are limited to 5 minutes and precisely 20 slides that auto-advance every 15 seconds.


Thanks to Dave Gray for tweeting a link!

Wednesday
Jan062010

Digital Podge 09 - Fantastic infographic website design

A fantastic, infographic website design for Digital Podge 2009.  Digital Podge is an annual, invitation-only lunch in London, UK for only 160 invitees.  The 2009 event was held on December 19th, and since the invite list was fixed at 160, a number of the infographics deal with data about the attendees.  Each attendee has a bar beneath their photo indicating how many connections they have on LinkedIN.

The About page shows a map of where the attendees traveled from to get to the event.

The Menu page show a breakdown of the lunch entree selections made by the attendees.

The Where? page is interactive, allowing the user to add or remove layers to the map that can show restaurants, bus stops, subway stations, parks, etc.

Designed by London digital agency Line, the site employs simple infographics with a touch of tongue-in-cheek humor.

“While simply being invited to Digital Podge is a huge honour in itself, being tasked with developing and carry out all the campaign touch points for the event is an exercise that holds the agency up to the scrutiny of its peers like no other project. It’s probably one of the most demanding briefs in the sector, but our team of designers and developers revelled in the opportunity to use data in a humorous and informative manner that highlights some of the plusses and minuses of a cutting edge industry,” said Ross Laurie, Managing Director at Line.