About
Randy Krum
President of InfoNewt.
Data Visualization and Infographic Design

Infographic Design

Infographics Design | Presentations
Consulting | Data Visualizations

DFW DataViz Meetup

Join the DFW Data Visualization and Infographics Meetup Group if you're in the Dallas/Fort Worth area!

Search the Cool Infographics site

Custom Search

Subscriptions:


Feedburner

The Cool Infographics® Gallery:

How to add the
Cool Infographics button to your:

Cool Infographics iOS icon

- iPhone
- iPad
- iPod Touch


Read on Flipboard for iPad and iPhone

Featured in the Tech & Science category

Flipboard icon

Twitter Feed
From the Bookstore

Caffeine Poster

The Caffeine Poster infographic

Entries in visual (320)

Tuesday
Dec222009

Holiday Cliché Find-It Graphic from Xplane.com


Check out this fun Holiday Cliché Find-It graphic from Xplane.com!  It's available as a 11x17" sized PDF so you can view or print it out.

“Get your ducks in a row” so that you aren't “caught with your pants down” this holiday season! After all, it can be like “herding cats” out there this time of year, and you definitely don't want to get stuck “in the weeds.” So, go ahead and take a minute to “shop this around,” “see if it sticks” and celebrate from a “10,000-foot view.” It's all “blue sky” from here on out, nothing but a “win-win situation!”

Think you know your business clichés? Find where they're hiding in this holiday XPLANATiON™ created by your friends at XPLANE! Just click the image above to download the tabloid-sized 11x17" PDF.
Thanks to Parker at Xplane.com

Friday
Dec182009

Word Spectrums! The Online Infographic Battleground


On Chris Harrison's site, there are a number of graphics that he calls Word Spectrums.  More like a battleground, Chris is using the enormous amount of data from websites that has been made public by Google.  This is an advanced form of a word cloud that visualizes related words and their relative connections to the two topics.  (FYI, since this is based on raw Google data, foul language does appear in some of them).


Using Google's enormous bigram dataset, I produced a series of visualizations that explore word associations. Each visualization pits two primary terms against each other. Then, the use frequency of words that follow these two terms are analyzed. For example, "war memorial" occurs 531,205 times, while "peace memorial" occurs only 25,699. A position for each word is generated by looking at the ratio of the two frequencies. If they are equal, the word is placed in the middle of the scale. However, if there is a imbalance in the uses, the word is drawn towards the more frequently related term. This process is repeated for thousands of other word combinations, creating a spectrum of word associations. Font size is based on a inverse power function (uniquely set for each visualization, so you can't compare across pieces). Vertical positioning is random.


Chris has created and shared a number of different versions on the Word Spectrum page of his website, and you can see high-resolutions PDFs of each there.

Want to try your own?  Building on Chris' idea, Jeff Clark from Neoformix has created interactive Word Spectrums using either Twitter or News as the source that lets you enter your own terms to compete.  I especially like the idea of pitting two competing brands against one another.


Wednesday
Dec162009

FREE Infographic Holiday Cards!


Once again this year, Funnel Inc. is offereing a free set of Holiday Infographic Cards to anyone who registers on their mailing list "while supplies last!"  You won't find the link on the main website, but here is the link for readers of Cool Infographics.


Also, there are four FREE Holiday desktop infographic images available on the same page at various resolutions.


Thanks to Lin at Funnel Inc. for keeping the link up for my readers!

Saturday
Dec122009

My Digital Life - personal infographic


My Digital Life, is an quick infographic by me!  A mindmap or network map of the digital products in my life, and how they all interconnect. Each connection is color-coded by the connection type (USB, wireless, ethernet, etc.) including its respective standard icon.  High-res version is on Flickr.

This started as a simple sketch to help me determine how to add a new external hard drive I got on Black Friday, but it quickly became much more fun to see how far out I could push the network.  I already know of some more that I want to add, so someday there may be a 2.0 version.  Apparently, I could use an IT manager at home.


I did ignore some differences within the connection types to keep this fairly simple.  I don't distinguish between USB 1.1 and USB 2.0 connections.  I use "Display" as a connection type, but its a DVI connection for the MacBook, a HDMI connection from the AppleTV and a composite connection from the DVD player.  I also show only one "Wireless" connection, but I know that the iPhone only uses 802.11g and the laptop uses 802.11n.

I did this using OmniGraffle, with a little help from Pixelmator and Keynote to clean up the images.

Monday
Dec072009

A Visual History of the Supreme Court - New Infographic Poster!


Today, I want to share the launch of Timeplots.com.  A new infographic site focused on designing visual timelines by Nathaniel Pearlman and Frank Hamilton.  The Timeplots.com site launched today highlighting their first project; a poster called “A Visual History of the Supreme Court of the United States”.

This large-scale (48″x32″) print displays the full sweep of American federal judicial history from 1789 to 2009. It combines biographical information on every Supreme Court justice with a visualization of the influence of U.S. presidents and their political parties on the Court over time, and includes vote counts and summaries of landmark cases.

Months of work went into researching the history of the Supreme Court, and that effort really shows through in the level of detail in this poster.


It’s a good thing they offer this as a large format poster, because the detail draws you closer to discover the events and landmark decisions that are the colorful history of the SCOTUS (Supreme Court of the United States).


I love that even on their About page, they created small, infographic timelines as a visual of their individual experiences and career histories.  Here’s Nathaniel’s:


Timeplots has also started a new service, Timeplots on Demand:

Timeplots’ dedicated staff is ready to work directly with you to honor your own organization—your company, school, nonprofit, team, church, or family—with a custom Timeplot of your institution’s history. Let us help you collect data, create memorable images, and visualize the developments of your institution.

Congratulations to both Nathaniel and Frank!


Friday
Dec042009

Enter the "Visualize The BCS" Infographic Contest! #BCSvisual


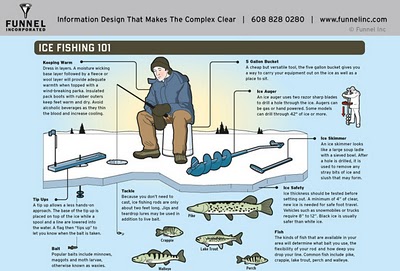
Think you can design an infographic?  Well now's your chance to prove it!

Announcing the "Visualize the BCS" contest from InfoJocks.com!  The Bowl Championship Series causes a ton of debate between sports fans over the holidays.  We want you to design an infographic about the BCS.  What to visualize is completely up to you, but must meet two criteria: 1) relate to the BCS and 2) use statistics.  Should be easy, right?

Prizes:  Three winners. Best Entry gets two posters of their choice and a $50.00 gift certificate to ESPN’s online store. And to keep it interesting, Most Artistic Entry and Most Analytical Entry both receive posters as well. All entrants with legitimate entries will receive a free set of our Taxonomy of Team Names gift cards.

Of course, I will post the winners here on Cool Infographics and maybe more of the entries as well.

Deadline:  All entries are due January 1, 2010. The winner will be selected before the National Championship is played. Send your entry in PNG, JPEG, or PDF format to contest@infojocks.com, along with your mailing address.

Visit the InfoJocks.com blog for complete details and some ideas.  Jeremy will be posting some links to possible resources and datasets next week.

Spread the Word!  Also, from Cool Infographics you can win a free poster by helping us spread the word.  Tweet about the contest on Twitter with a link back to this post and include the hashtag #BCSvisual.  On December 21st, I'll use a random number generator to pick a random qualifying Tweet and send you a free poster from Infojocks.  (only one Tweet per person will qualify)  An example Tweet would look like this:

Enter the "Visualize The BCS" infographic contest by Infojocks and Cool Infographics!  #BCSvisual http://bit.ly/8Fo4Ii


Remember, everyone who enters will receive a FREE set of Taxonomy of Team Names gift cards.

Wednesday
Nov182009

Visual Map of 30 Free Online Promotion Websites


Great visual map of the connections between free online sites to promote your content.  Made by Chris Watson at Visualization Magazine.
This visualisation was made to help inform and advertise on how easily and effectively you can use the web 2.0 tools to build an online presence through free sites, feeds, embed and monitor progress/stats.
Chris also has links to all of these icons in his post in case you want to create your own Web 2.0 visual.

Tuesday
Nov172009

Webpages As Graphs - Cool HTML visualizer applet


Marcel Salathe has created Webpages As Graphs, an interactive HTML DOM visualizer applet that will view any http:// website in a graphic form.  The image above is Cool Infographics, but the arrangement comes out a little different every time you run it.

Using Processing, Traer Physics and HTMLParser the site lets you enter the domain and then watch while it works its magic.  He has also made the source code available and instructions to print your graph as a poster.

HTML consists of so-called tags, like the A tag for links, IMG tag for images and so on. Since tags are nested in other tags, they are arranged in a hierarchical manner, and that hierarchy can be represented as a graph. I've written a little app that visualizes such a graph
I ran it for a number of other websites to see the differences, some were inspired by the examples on Marcel's site.

Amazon.com: Pretty complex site with lots of links, images and tables.


Apple.com: Simple design, as you expect from Apple.


Google.com:  Known for their clean front page.


LifeHacker.com:  Great blog with a very complex structure.


Friday
Oct302009

What's a Gruzzle?


So, what's a Gruzzle?  With extensive use of Venn Diagrams, GL Hoffman often posts these visual blog posts on his blog, What Would Dad Say, and Fast Company has also started pubishing them as well.


So back to the original question, What's a Gruzzle?  Here's a really good answer, by one of his readers:


But here's the official answer:


You can also follow @GLHoffman on Twitter

Thursday
Oct292009

Visualizing American 2009 TV Season Ratings


Rachel Cunliffe has created a great infographic for the new 2009 US TV shows showing how their viewer numbers are fairing compared to each other and their own premiere episodes.  I only see three shows that have a higher average viewers than their premiere.  Others are not doing well at all, and they probably won't be around for much longer...
Here's a summary of how the new season TV shows are faring in the US based on episodes screened to date.
For comparison purposes, this year's American Idol premiere ratings have been included.
TBL, aka The Beautiful Life, has already been canned by the CW.


Great work Rachel!  You can follow Rachel on Twitter at @cre8d